

Financial independence · the month the bills get covered
Financial Freedom Calculator
Short answer
Picture the checks you already get: $1,200 of rentals, $200 of dividends, $100 of crypto staking, and $250 from a side business. That is $1,750 a month, 35% of a $5,000 goal. Keep the raises, add $300 of rent every 24 months, put $500 a month into dividends, and leave DRIP on. The crossing of $5,000 is month 133 (11 years 1 month), at $5,101.26. Inflation at 3% moves that to month 216. Add a rental every 12 months instead of every 24 months and you land in month 96, 3 years 1 month sooner. Illustration, not a forecast.
Last reviewed: November 2026. Illustration, not a forecast.
Financial freedom calculator
This financial freedom calculator answers the first month your streams cover a spending goal. It is for someone who already collects rent, dividends, or a side profit and wants a date, not a net-worth trophy. Add the monthly cash flow you have, how each stream grows, and the monthly goal. The freedom date is the first month the total covers the goal. The streams below are a made-up mix, not anyone's accounts. The honest catch: those streams can shrink. Educational only. Not financial advice.
How to use this calculator
- Type the monthly goal. The example is $5,000. Leave inflation at 0% unless you want the goal to rise.
- Type each stream you already receive: rentals, dividends, crypto, a side business, and other.
- Set the growth rates and the adds you plan to keep making. DRIP starts on.
- Read the freedom month. On the example it is month 133, at $5,101.26.
- Add a start date only if you want a calendar label. Blank keeps the month number.
- Use the crossover chart to see passive income against spending, one month at a time.
What the numbers mean
- Freedom month
- The first month the streams cover the goal. On the example that is month 133.
- Passive income today
- Rentals, dividends, crypto, side business, and other, added up. The example is $1,750.
- Gap
- The goal minus what arrives today. $5,000 minus $1,750 is $3,250.
- Crossover
- The month passive income meets spending on the chart. Month 132 is still short. Month 133 clears it.
- Calendar label
- A month and year counted from the start date. Leave the date empty and this stays off, so the month index remains the result.
Worked example: $1,750 a month today, $5,000 goal
Start: rentals $1,200, dividends $200, crypto $100, side business $250, other $0. Total $1,750. Goal $5,000 with inflation off. Rent grows 3% a year and a new $300 rental arrives every 24 months. Dividends get $500 a month of new savings, a 3.5% yield on that new money, 5% dividend growth, and DRIP on. Crypto does not grow. The side business grows 10% a year.
End of year 1: rentals $1,200.00, dividends $224.90, crypto $100.00, side $250.00, total $1,774.90. End of year 5: $1,987.43, $395.39, $100.00, $366.03, total $2,848.84. End of year 10: $3,259.90, $706.85, $100.00, $589.49, total $4,656.23. Still short of $5,000.
Month 133 (11 years 1 month): rentals $3,458.42, dividends $829.56, crypto $100.00, side $713.28, total $5,101.26. That is the first month the total clears the goal. The page keeps going to month 600 so the chart can show the path after the crossing. If you open the page this month, month 1 is this month, and the card names the calendar month 132 months later. The label that does not depend on the calendar is 11 years 1 month (month 133).
How your cash flow freedom date is calculated
Annual growth happens once a year, at the start of months 13, 25, 37, and so on, before any new rental is added and before that month's dividend contribution. The goal inflates on that same step. A new rental is added when the month number divides evenly by "every N months," after the growth step. Zero means you never add one.
Dividends: each month, new savings plus reinvested dividends (if DRIP is on) buy more income at the yield on new money. DRIP uses the dividend balance after that year's raise, so the raise hits before the contribution in the anniversary month. Crypto, the side business, and other income only get the annual growth step. They do not get a monthly contribution box.
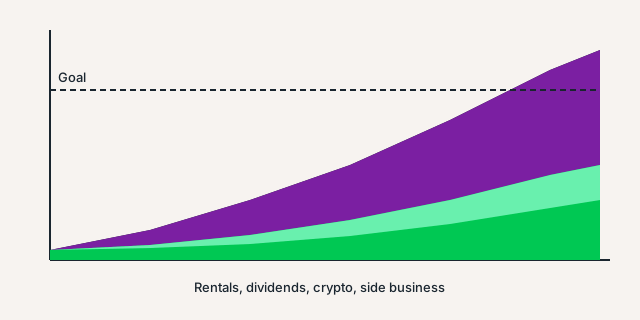
Freedom is the first month the total is at least the goal, and only when the goal is above $0. The stacked chart starts at month 0, which is today's income, then draws each stream as its own band so a $0 "other" line does not paint over the rest. The goal is a dashed line. A mint line marks the freedom month.
The levers that move your freedom date
One change at a time, from the default plan that finishes in month 133. Adding rentals twice as often (every 12 months instead of every 24) is the biggest move in the table: month 96, which is 3 years 1 month sooner. Doubling the dividend contribution, from $500 to $1,000, lands in month 121, one year sooner.
Inflation at 3% moves the date to month 216, 6 years 11 months later, about 7 years. DRIP off moves it to month 144, 11 months later. Side-business growth at 0% instead of 10% moves it to month 145, one year later. A $10,000 goal, which is not a row in the live table, lands in month 241 (20 years 1 month) if nothing else changes.
The rental lever is the one that moves the date the most in this mix, because each new property drops a chunk of income in at once. It is also the lever that needs a down payment, a loan, and a tenant the chart does not draw. Faster on the chart is not the same as easier in the month you have to write the check.
Why a cash flow goal beats a net worth number
A net worth number does not pay the electric bill. $5,000 a month does, if it actually arrives. This financial freedom calculator tracks the arrival, stream by stream, and ignores account balances on purpose.
The 4% rule and a cash flow goal answer different questions. One spends a portfolio. The other asks what your assets already pay you. Both are in cash flow versus the 4% rule. The difference between a large net worth and a monthly deposit is in net worth versus cash flow. Use those pages when the argument is about which scoreboard you are playing. Use this page when you want a month.
One income stream or many?
Today, rentals are 69% of $1,750. At month 133 they are about 68% of $5,101.26 ($3,458.42). The page flags any stream over 60%: one stream doing most of the work is a risk. A vacancy, a dividend cut, or a dead side business hits harder when it is the pile.
Five lines that all depend on the same job, the same city, or the same coin are not five streams. Crypto stays $100 here because growth is 0%, which is already a hint not to build the plan on it. Dividends and the side business are the diversification in this example, and together they are still the minority at the freedom month. Spread is a feature. A chart that looks tidy because one bar does all the lifting is the thing the note is pointing at.
Frequently asked questions
How much passive income do I need to be financially free?
Whatever amount covers the spending you typed. The example uses $5,000 a month. Today the five streams (other is $0) total $1,750, which is 35% of that goal. The how much cash flow to quit page works the spending number. This page asks when the streams you already have, plus the adds you keep making, cross it.
How long does it take to reach financial freedom?
On the default inputs, month 133: 11 years 1 month. Cash flow that month is $5,101.26 against a $5,000 goal. Inflation at 3% pushes it to month 216 (18 years). A $10,000 goal, with everything else unchanged, lands in month 241 (20 years 1 month). If the goal is already covered, the first month inside the loop is month 1. A goal of $0 is not treated as freedom. The date moves when the inputs move. It does not move because you hoped.
What counts as passive income here?
Rent you receive, dividends, crypto staking rewards, side-business profit, and an "other" line. Each one is a monthly dollar amount, not an account balance. A side business that needs you every day is only as passive as the profit that shows up when you step away. Staking rewards can stop or swing. The crypto line links a longer note and starts with a volatility warning. If it does not hit the bank, it does not count.
Should I count my 401(k) or home equity?
Not as a balance. This page adds monthly cash flow. A 401(k) counts only if you turn it into income you can spend, and this model does not do that conversion. Home equity counts when it pays you (a house hack, a rental) and does not count as a number on a statement. Net worth and cash flow are different questions. See net worth versus cash flow. A statement balance does not pay the electric bill.
Should the goal include inflation?
The default leaves inflation at 0% so you can see the date against a fixed bill. Turn on 3% and the same plan takes month 216 instead of month 133, which is 6 years 11 months later (about 7 years). The goal steps up once a year, at the same moment the income streams get their annual raise: the start of months 13, 25, 37, and so on. Prices can rise faster than 3%. The toggle is an illustration, not a promise about groceries.
Which stream grows fastest?
The highest rate in the example is the side business at 10% a year. It goes from $250 to $713.28 by month 133. Rentals grow at 3%, but a new $300 of rent every 24 months does more work: rentals go from $1,200 to $3,458.42 and are about 68% of the $5,101.26 total. Dividends, with $500 a month of new savings and DRIP, go from $200 to $829.56. Crypto at 0% growth stays $100. The fastest rate and the biggest pile are not the same stream. Do not let the side-business percent distract you from the rent check.
What does the crossover chart show?
Passive income and spending for every month the engine already builds, from month 0 through month 600. On the example, month 132 is still short at $4,892.50 against a $5,000 goal. Month 133 is the first month income clears spending, at $5,101.26. Inflation off keeps the spending line flat at $5,000. The chart is the same math, drawn so you can see the gap close.
Does the inflation switch move the default month?
Not while it is off. Inflation starts at 0%, which is the published path: month 133 at $5,101.26. Choosing 3% is the same as typing 3 in the inflation box, and that path is month 216. Turning the switch back to off returns month 133. The default month does not sneak off while the switch stays off.
How do I see a calendar month and year?
Leave the start date blank and the result stays a month number. Month 133 is the example. Type a start date and month 1 is that month. A start of January 2026 labels month 133 as January 2037. The date does not change the month index, and the share link omits it when the box is empty. The calendar label is a convenience, not a new calculation.
More free loan and debt tools: 15 vs 30 year mortgage, DSCR loan, HELOC, debt snowball, rent vs buy, cash-out refinance. See the full loans and debt list.
Educational only. Not financial advice. Rents, dividends, staking rewards, and business profits can fall or stop. The freedom month is an illustration, not a forecast.