

Dividends · Shares that buy more shares
Dividend Snowball Calculator
Short answer
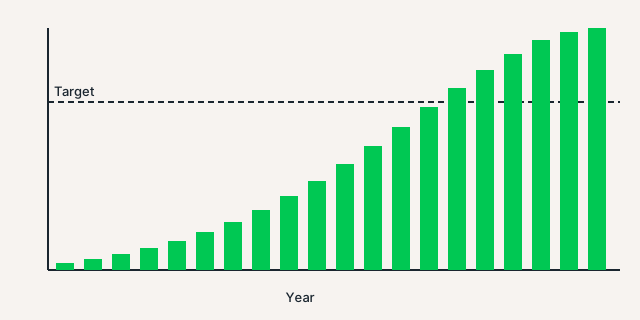
A dividend snowball calculator shows how reinvested dividends and steady buying compound into monthly income. Start with $10,000, add $500 a month at a 3.5% yield, and let dividends grow 6% a year with DRIP on. By year 20 you've put in $130,000 and the portfolio pays about $1,261 a month, crossing $1,000 in year 19. Turn DRIP off and it pays about $763. Doubling the monthly buy matters more than any other lever: $1,000 a month gets to $1,000 of income five years sooner.
Last reviewed: November 19, 2026. Growth history from S&P 500 dividend data. Illustration, not a forecast.
Dividend snowball calculator
It answers when reinvested dividends, plus the check you send each month, might cover a monthly income goal. Someone who can name a starting pile and a monthly buy is who this is for. The caveat is the whole point of the cut switch: a company can shrink the dividend, and this chart will not stop that. Educational only. Not financial advice.
Use 0 for an IRA or a 401k. 15 is a common qualified-dividend rate in a taxable account, and it is still an estimate.
Leave this off and the example stays where it is. The tax percent box still works for older links. Turned on, IRA uses 0%. Taxable uses that percent, or 15% if the box is still 0.
Inflation starts at 0, so today's dollars match the year table. The goal year still uses nominal income.
The year can sit in the box. The cut does not hit the path until the switch is on.
Educational only. Not financial advice. Illustration, not a forecast.
| Year | Total contributed | Dividends received this year | Portfolio value | Dividends paid out | Monthly dividend income | Yield on cost | Current yield |
|---|
How to use this calculator
- Start from the example, or type the cash on hand, the monthly buy, the yield, and the dividend growth.
- Leave DRIP on if the cash buys more shares. Turn it off if the dividends get spent instead.
- Leave tax drag and the dividend cut off when the example is what you want. Turn tax drag on to compare a taxable account with an IRA.
- Read monthly income, portfolio value, and the year the target is reached. That year is the one that pays the bills, not the portfolio total.
- Use the marks for $100, $500, and $1,000 a month. Copy the link or download the CSV if the run is worth keeping.
What the numbers mean
- Monthly dividend income
- Forward dividend after the tax drag, divided by 12, at the end of the year. That is the number that pays a bill.
- Portfolio value
- Share count times the modeled price. It is not a quote, and it is not cash in the account.
- Total you put in
- Starting cash plus the monthly buys. Reinvested dividends are not inside this number.
- Yield on cost
- The after-tax dividend stream divided by the dollars contributed.
- Target year
- The first year monthly income reaches the target. The search can run past the table, out to 60 years.
Worked example: $10,000 plus $500 a month
Same settings as the calculator defaults: 3.5% starting yield, 6% dividend growth, 5% price growth, quarterly payouts, DRIP on, tax drag 0, and a $1,000 monthly target. Illustration, not a forecast.
| Year | Total contributed | Dividends received | Portfolio value | Monthly income |
|---|---|---|---|---|
| 1 | $16,000 | $484 | $17,129 | $47.58 |
| 5 | $40,000 | $1,700 | $52,474 | $151.39 |
| 10 | $70,000 | $4,095 | $117,714 | $356.10 |
| 15 | $100,000 | $8,062 | $219,222 | $695.37 |
| 18 | $118,000 | $11,613 | $306,213 | $999.32 |
| 19 | $124,000 | $13,061 | $340,960 | $1,123.31 |
| 20 | $130,000 | $14,666 | $379,079 | $1,260.79 |
Year 18 lands at $999.32 a month, so close it is annoying. Year 19 clears $1,000 at $1,123.31. The dividend snowball in this table still depends on the raises and the price path you typed. A cut, a pause in contributions, or a falling price moves the year.
Dividends received are after the tax drag. At 0% tax, year 1 shows $484 and year 20 shows $14,666. You contributed $16,000 by the end of year 1 and $130,000 by year 20. The monthly figure is the forward income from the shares you hold at year end, not an average of the year behind you.
How the DRIP calculator works
A dividend snowball is shares, cash dividends, and time doing the same small job over and over. Nothing here predicts a stock. It only replays the rules below.
- Each month your contribution buys shares at that month's price.
- Dividends are paid on the schedule you pick: monthly, quarterly, or once a year.
- DRIP spends the after-tax dividend on more shares. Turn it off and that cash is counted as paid out instead.
- At the start of each new year the annual dividend per share is raised by your dividend growth rate.
- The share price steps up with the price-growth rate, so later contributions buy fewer shares.
Forward monthly income is the share count times the annual dividend per share, times (1 minus the tax drag), divided by 12.
Yield on cost is that after-tax dividend stream divided by every dollar you contributed. It can rise while today's yield falls, because earlier shares were cheaper and the dividend per share was raised.
When you want real names with long raise streaks, pick names from our dividend aristocrats tracker, then try a yield you can defend.
What grows a dividend snowball fastest
The boring truth: the contribution is the lever you control most. DRIP and the tax rate change the result. They do not replace a bigger monthly buy. Every row below uses the same 3.5% yield, 6% dividend growth, 5% price growth, and quarterly payouts. Illustration, not a forecast.
| Plan | Portfolio at year 20 | Monthly income at year 20 | Year income reaches $1,000/month |
|---|---|---|---|
| DRIP on, tax 0%, $500 a month | $379,079 | $1,260.79 | 19 |
| DRIP off, tax 0%, $500 a month | $229,435, plus $79,559 paid out | $763.08 | 24 |
| DRIP on, tax 15%, $500 a month | $350,714 | $991.48 | 21 |
| DRIP on, tax 0%, $1,000 a month | $702,509 (you put in $250,000) | $2,336.49 | 14 |
Moving from $500 to $1,000 a month reaches the $1,000 target in year 14 instead of year 19. A 15% tax drag on the $500 plan pays $991.48 a month at year 20 and crosses $1,000 in year 21. DRIP off leaves $229,435 invested and $79,559 already paid to you, with $763.08 a month still coming. Spend the cash if you need it. Reinvest if you do not.
Taxes and account type
Qualified dividends and ordinary dividends are taxed differently, and the rate depends on your income. In an IRA or 401k the drag is often zero until you take money out. In a taxable account, 15% is a common rate on qualified dividends. That is why the tax input exists.
The calculator applies your percent to each dividend before it reinvests or pays cash out. It does not model tax brackets, foreign withholding, state tax, or the tax on a sale. Check your own situation or ask a tax pro. This is not tax advice.
Common dividend snowball mistakes
- Chasing a high yield. A yield over 8% often gets cut. Read yield vs payout before you treat a fat yield as free money.
- Assuming raises never stop. The default 6% raise happens every year in this model. Real boards skip years. A long streak is a history, not a contract. Paste a stock's payout history into the dividend growth rate calculator and use its 3-year rate if that's lower than the 10-year one.
- Mixing a high yield with high growth. The S&P 500 grew its dividend about 6% a year over the last decade but yields only about 1.1% today. A 3.5% yield with 6% growth is a fine illustration, yet few single stocks deliver both for 20 years. Run the pair through the Chowder rule calculator as a sanity check.
- Forgetting the price can fall. Price growth is an input, not a law. A lower price can raise the yield for new money and still shrink the portfolio value.
- Ignoring total return. Cash dividends plus a shrinking account can leave you behind. See yield vs total return.
- Turning DRIP on before you have watched a payment. Let a few deposits land first so you know the cash is real. The checklist is in dividend income basics.
Frequently asked questions
What is a dividend snowball?
A dividend snowball is the loop where dividends buy more shares, those shares pay more dividends, and the raises stack on top. In the default illustration, $10,000 plus $500 a month at a 3.5% yield and 6% dividend growth reaches $1,260.79 a month by year 20. That picture is an illustration, not a forecast.
What does DRIP mean?
DRIP means dividend reinvestment: the cash from a dividend buys more shares instead of landing in the account. This calculator turns that on or off. With DRIP on, year 20 monthly income is $1,260.79. With DRIP off, it is $763.08, and $79,559 has been paid out along the way.
Is DRIP better than taking the cash?
It depends on whether the cash is needed now. DRIP grows the share count, so later income is higher in this illustration ($1,260.79 a month vs $763.08). Taking the cash pays you along the way: $79,559 by year 20, with a smaller portfolio ($229,435 vs $379,079). Neither path is a promise.
How long does it take to live off dividends?
In the default example the income crosses $1,000 a month in year 19. Raise the monthly buy to $1,000 and the same yield and growth cross $1,000 a month in year 14, with $2,336.49 a month by year 20. Bills, taxes, and any cuts move that year. This is not a timeline anyone can count on.
What dividend growth rate is realistic?
Something near 5% to 7% has real history behind it. S&P 500 dividends per share rose from $43.39 in 2015 to $78.92 in 2025, about 6.2% a year, and that decade had no cut. The 2005 to 2015 decade, which included a 21% drop in 2009, still averaged about 6.9%. So the 6% default is reasonable for a broad basket. Growth over 10% for 20 years is rare. Check any single stock with the dividend growth rate calculator before you type its number here.
Does this calculator include taxes?
Yes, as a simple drag on each dividend. Use 0 in an IRA or 401k. 15% is a common qualified-dividend rate in a taxable account, and at that rate the default plan pays $991.48 a month at year 20 and crosses $1,000 in year 21. Check the real situation, or ask a tax pro. This is not tax advice.
What does the dividend tax drag toggle do?
It starts off, so the example stays at $1,260.79 a month. Turn it on and pick IRA to use a 0% drag, or Taxable to use the tax percent. If that percent is still 0, Taxable uses 15%. Older links that set the tax percent keep the same result while the toggle stays off.
What do the $100, $500, and $1,000 marks mean?
They mark the first year forward monthly income reaches each amount. They sit on the chart path. They do not change the balance or the income.
What does the 25% dividend cut do?
It starts off, so the year box does not change the result. Turn it on and the dividend per share drops 25% at the start of the year you pick, after that year's raise. The default monthly income stays $1,260.79 until you turn it on.
Educational only. Not financial advice. Projections are illustrations that use the numbers you type, not forecasts. Dividends can be cut, prices can fall, and taxes vary.