

Loans · Two terms, one house
15 vs 30 Year Mortgage Calculator
Short answer
On a $320,000 loan at November 2026 average rates, the 30-year payment is $2,167.79 and the 15-year is $2,799.87. The 15-year costs $632.08 more a month and saves $276,427.89 in interest, which is cash that never leaves for the lender. Invest that $632 at 7% instead and you still come out behind at year 30 unless you earn more than about 8.24% a year. This calculator is for a buyer comparing two quotes, or a homeowner deciding whether the higher payment is worth it. The caveat: these are example rates, not offers, and the gap only helps if you can actually pay it.
Last reviewed: November 2026. Illustration, not a forecast.
15 vs 30 year mortgage calculator
It answers which term leaves more in your pocket each month, and which one hands less interest to the lender. Type a price, a down payment, and two loans, and add a third if you want a 20-year quote in the same picture. A buyer holding two rate sheets is who this is for, and the caveat is that example rates are not offers. Educational only. Not financial advice.
Amortization schedule
| Period | Payment | Principal | Interest | Extra | Balance | Cumulative interest |
|---|
Need a single-loan schedule with yearly or one-time extras? Try the amortization calculator.
How to use the 15 vs 30 year calculator
Start from the example rates, then replace them with the quotes sitting in your email.
- Enter the price and the down payment. At $400,000 and 20% down, every column uses the same $320,000 loan.
- Set Loan A and Loan B. The defaults are 30 years at 7.18% and 15 years at 6.57%, and you overwrite them the moment a lender gives you a real number.
- Read the monthly gap. The 15-year costs $632.08 more a month and saves $276,427.89 in interest. That gap is principal and interest only, not the whole house payment.
- Check the 20-year column and the 5% gap. The 20-year payment is $2,457.00. Investing the $632.08 gap at 5% for 30 years is its own balance, about $526,054.85. Leave the toggle off if you want that balance kept out of the 7% winner.
- Add taxes, insurance, and PMI only when you want PITI. They start at 0, so the old principal-and-interest comparison stays put until you type them.
- Save the comparison. Copy the link, download the schedule as CSV, or print it. New fields stay off the link while they are still sitting at their defaults.
What the numbers mean
- Monthly gap
- The 15-year principal and interest minus the 30-year principal and interest. On the defaults that is $2,799.87 minus $2,167.79, which is $632.08. That is the number that matters each month. Extra principal is not inside it.
- Interest saved
- Lifetime interest on the 30-year loan minus lifetime interest on the 15-year loan, before any extra payments. The defaults save $276,427.89 ($460,404.93 minus $183,977.04).
- 20-year column
- The same $320,000 at 6.875% for 20 years. Payment $2,457.00. Total interest $269,680.83. It sits beside the other two and does not change the $632.08 gap. If you set Loan A or Loan B to 20 years, this extra column steps aside so the term is not listed twice.
- Invest the payment gap at 5%
- The $632.08 gap deposited every month for 360 months at 5% grows to about $526,054.85. It is shown on its own line. The toggle that adds it onto the 30-year side starts off.
- The 7% comparison
- The older race, still at a 7% return. At year 30 the 15-year household is at $1,207,454.00 and the 30-year household is at $1,091,120.46. Investing the gap wins only above about 8.24% a year. The 5% balance is not added to those totals while the toggle is off.
- Taxes, insurance, and PMI
- Full PITI adds annual tax divided by 12, annual insurance divided by 12, and PMI while the balance is above 78% of the price. All three default to 0, so the principal-and-interest cards stay $2,167.79 and $2,799.87.
Worked example: $400,000 house, 20% down
Price $400,000. Down payment 20%, so the loan is $320,000 on every column. Rates are the Freddie Mac PMMS averages for the week of November 5, 2026, plus a 20-year at 6.875% if you turn Loan C on. No extra payment in this table. Illustration, not a forecast.
| Item | 30-year at 7.18% | 15-year at 6.57% | 20-year at 6.875% |
|---|---|---|---|
| Loan | $320,000 | $320,000 | $320,000 |
| Monthly P&I | $2,167.79 | $2,799.87 | $2,457.00 |
| Total interest | $460,404.93 | $183,977.04 | $269,680.83 |
| Total P&I paid | $780,404.93 | $503,977.04 | $589,680.83 |
| Principal paid by year 5 | $18,206.62 | $74,191.16 | $44,506.19 |
| Principal paid by year 10 | $44,248.74 | $177,141.73 | $107,208.44 |
| Principal paid by year 15 | $81,498.51 | $320,000.00 | $195,546.09 |
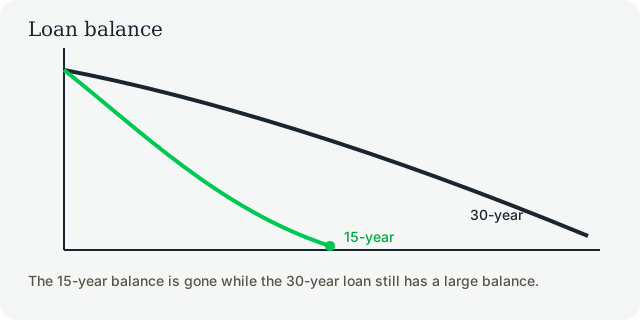
By year 5 the 15-year has retired $74,191.16 of principal. The 30-year has retired $18,206.62. Same house, same down payment, very different equity from paydown. Appreciation is not in these numbers. The house is the same either way.
Interest is the bill for borrowing. On the 30-year you pay $460,404.93 to borrow $320,000. On the 15-year you pay $183,977.04. The 20-year sits in the middle at $269,680.83. None of this includes taxes, insurance, or PMI. Add those in the escrow box if you want a total monthly check.
15 vs 30 year mortgage: what really changes
Four things change: the payment, the rate, the interest, and how fast you build equity from paydown. The house does not change. Flexibility does. The 30-year keeps $632.08 a month in your pocket. The 15-year spends it on principal.
Use the calculator above if your price is not $400,000. The shape of the answer is usually the same. A shorter term at a lower rate builds equity faster and costs more every month.
| Principal paid | 30-year | 15-year |
|---|---|---|
| Year 5 | $18,206.62 | $74,191.16 |
| Year 10 | $44,248.74 | $177,141.73 |
| Year 15 | $81,498.51 | $320,000.00 |
At year 15 the 15-year loan is gone. The 30-year still owes $238,501.49 ($320,000 minus $81,498.51). That remaining balance is the price of the lower payment. It is also the reason a sale or a refinance in year 8 looks different on the two loans.
Extra payments vs a shorter loan
A 30-year plus $200 a month is not a 15-year, and that is the point. On this $320,000 loan the extra $200 pays it off in 278 months, which is 23 years 2 months. Interest falls to $336,316.17. You save $124,088.76 versus the minimum payment, and you can skip the extra in a bad month.
The 15-year saves more interest ($276,427.89) because the payment is $632.08 higher and the rate is lower. You cannot skip that $632.08. If a job loss or a repair hits, the 15-year still wants $2,799.87. The 30-year with a voluntary extra wants $2,167.79, and the extra is optional.
Prepayment penalties are rare on standard owner-occupied mortgages. They are more common on some investor loans. Read the note before you plan on extra principal. The calculator assumes the lender accepts the extra with no fee.
Invest the difference (the honest version)
The popular line is: take the 30-year, invest the $632.08, and beat the 15-year. At 7% a year, monthly, you do not. At year 15 the 15-year household has $320,000.00 of principal paid and $0 invested. The 30-year household has $81,498.51 of principal paid and $200,345.84 invested, for $281,844.35. The 15-year is ahead.
At year 30 the 15-year household has the paid-off loan plus $887,454.00 invested, $1,207,454.00 in all. The 30-year household has $320,000.00 of principal paid plus $771,120.46 invested, $1,091,120.46 in all. Still behind. Investing the difference wins only if you earn more than about 8.24% a year, every year, after taxes.
Returns are not guaranteed. A bad sequence of returns in the year you need the money can erase the spreadsheet. And the comparison assumes you invest the gap every month, not that you spend it. Most people spend it. The honest win for the 30-year is flexibility: $632.08 a month you can aim at a repair, a layoff, or an actual investment account.
A second line invests that same $632.08 at 5% for 30 years and shows about $526,054.85 on its own. The toggle that adds it to the 30-year side starts off, so the $1,207,454.00 and $1,091,120.46 figures stay as they are.
Which loan fits a cash flow investor
For a rental, the lower payment usually wins. More of the rent is left after principal and interest, and the DSCR a lender computes is higher. A 15-year can turn a deal that barely cash flows into one that needs a check from you every month. Run the rent through the SFR rental calculator at both terms before you fall in love with the interest savings.
For the house you live in, a faster payoff lowers the cash flow you need later. Killing a $2,167.79 payment is a real cut in the number from how much cash flow it takes to quit your job. The tradeoff is the same one in pay off a rental or buy another: certain interest saved versus cash you could have used on the next deal. Neither choice is free.
Common mortgage comparison mistakes
- Comparing payments only. The 30-year looks cheaper by $632.08 and then costs $276,427.89 more in interest.
- Ignoring points. A point is prepaid interest. One point on $320,000 is $3,200 due at closing. Put it in the points box.
- Forgetting escrow and PMI. Taxes, insurance, and PMI do not shrink because you picked 15 years. They can be the larger half of the check.
- Stretching for a 15-year with no emergency fund. The interest savings are real. So is the missed mortgage payment if the furnace dies and the savings account is empty.
- Assuming you will invest the difference. The year-30 math needs every one of those $632.08 deposits. A plan you do not fund is a story, not a balance.
Frequently asked questions
Is a 15-year mortgage worth it?
On this $320,000 example, only if the payment fits the rest of the month. The 15-year at 6.57% costs $2,799.87 a month and $183,977.04 in interest. The 30-year at 7.18% costs $2,167.79 and $460,404.93 in interest. You save $276,427.89 and own the house in half the time. It stops being worth it the moment the higher payment empties the emergency fund.
How much more is a 15-year payment?
In the default illustration the 15-year payment is $632.08 higher than the 30-year ($2,799.87 versus $2,167.79). That gap is principal and interest only. Taxes, insurance, and PMI are the same on both loans and are not inside that $632.08. Your quote will differ. These are example rates, not offers.
Is it better to pay extra on a 30-year?
An extra $200 a month on the 30-year pays the $320,000 loan off in 278 months (23 years 2 months) and cuts interest from $460,404.93 to $336,316.17. That saves $124,088.76, and you can pause the extra if the roof fails or the job does. A 15-year does not leave that door open. Check the note for a prepayment penalty. They are rare on standard owner-occupied loans, but read the note anyway.
Does investing the difference beat a 15-year?
At a steady 7% it does not, in this illustration. At year 30 the 15-year household is at $1,207,454.00 (the paid-off loan plus $887,454.00 invested). The 30-year household is at $1,091,120.46. Investing the $632.08 gap wins only if you earn more than about 8.24% a year, every year, after taxes. Returns are not guaranteed, and the gap only counts if you actually invest it instead of spending it.
Why are 15-year rates lower?
Lenders get their money back sooner, so they usually charge less for the privilege. The week of November 5, 2026, the Freddie Mac PMMS average was 6.57% for 15 years and 7.18% for 30 years, a gap of 0.61 points. That gap is why the interest savings are larger than the shorter term alone would suggest. Shop the rate. Do not assume the gap stays 0.61 points.
Should rental properties use 15 or 30-year loans?
Most cash flow investors take the 30-year, and the reason is the monthly check. A lower payment leaves more rent in your pocket and a stronger DSCR, which is what a DSCR lender looks at. A 15-year fits a primary home better when the goal is to cut the freedom number by killing the payment. Run the rental both ways in the SFR rental calculator before you lock a term.
What is the 20-year column?
A third loan on the same $320,000 at 6.875% for 20 years. The payment is $2,457.00 and total interest is $269,680.83. It sits beside the 15-year and the 30-year so you can see the middle path. It does not change the $632.08 gap between those two.
What does invest the difference at 5% mean?
The 15-year payment is $632.08 higher than the 30-year. Investing that gap every month for 30 years at 5% grows to about $526,054.85. That balance is shown on its own line. It is not added to the old 7% winner unless you turn the toggle on. The toggle starts off. Returns are not guaranteed.
Do taxes, insurance, and PMI change the 15 vs 30 comparison?
Not while they are zero. The default comparison is principal and interest only: $2,167.79 versus $2,799.87. Type annual tax, annual insurance, and a PMI rate if you want a full PITI check. Those three start at 0 and stay out of the share link until you change them.
More free loan and debt tools: DSCR loan, HELOC, debt snowball, rent vs buy, cash-out refinance. See the full loans and debt list.
Educational only. Not financial advice. Example rates, not offers. Your rate, points, taxes, insurance, and PMI will differ from this sketch. Get real quotes before you fall in love with a payment.