

Financial independence · what you own minus what you owe
Net Worth Calculator
Short answer
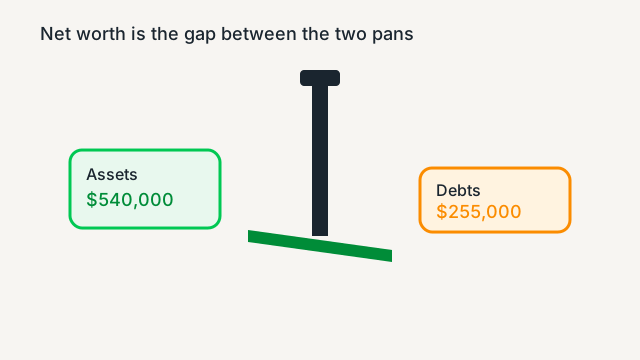
This sheet opens on $540,000 of assets and $255,000 of debts, which is $285,000 of net worth. $110,000 of that is the house you live in, and only 28.70% of the assets pay you anything. Investable net worth is $167,000. Liquid assets are $50,000, which covers 12.5 months of the $4,000 spending example. For comparison, the Fed's 2025 median for all families is $215,900. The house looks rich. The grocery line does not care.
Last reviewed: November 2026. Illustration, not a forecast.
Net worth calculator
This net worth calculator answers what you own minus what you owe, then splits out the part that could pay you. It is for a household that wants the balance sheet without pretending the house is a paycheck. On the example, $540,000 minus $255,000 is $285,000. Investable net worth is $167,000, because a house you live in and a car in the driveway do not pay the grocery bill. The honest catch: every value is your estimate. Educational only. Not financial advice.
How to use this net worth calculator
- Type each asset at what you could sell it for, not what you paid.
- Type each debt at the balance you still owe, not the minimum payment.
- Set monthly spending so the liquid months and the score have a target.
- Read net worth, then investable net worth, then the income-producing share.
- Save a snapshot. Come back next month and save another. The line chart needs dates.
- Export JSON if you want a backup you control. The share link does not include snapshots.
What the numbers mean
- Net worth
- What you own minus what you owe. Example $285,000.
- Liquid
- Cash, brokerage, and crypto. Example $50,000. Loans stay off this line.
- Investable net worth
- Assets minus the home, vehicles, other assets, and debts other than the mortgage and the auto loan. Example $167,000.
- Home equity
- The house minus the mortgage. Example $110,000. It is wealth. It is not a paycheck.
- Income-producing share
- Brokerage, retirement, rentals, crypto, and business, divided by assets. Example 28.70%.
- Debt to assets
- Liabilities divided by assets. Example 47.22%.
Worked example: $285,000 net worth
The net worth calculator starts with a household that looks comfortable on one line and thinner on the next. Assets are cash $15,000, retirement $120,000, brokerage $30,000, home $350,000, crypto $5,000, and vehicles $20,000. Rentals, business equity, and other assets are $0. The asset total is $540,000.
Debts are a $240,000 mortgage, a $12,000 auto loan, and $3,000 of credit cards. Rental loans, the HELOC, student loans, and other debts are $0. Liabilities are $255,000. Net worth is $285,000. Home equity is $350,000 minus $240,000, which is $110,000. Net worth excluding the home is $175,000.
Liquid assets are $50,000. Investable net worth is $167,000. Income-producing assets are $155,000, which is 28.70% of assets. Debt to assets is 47.22%. Monthly spending is $4,000, so the liquid pile covers 12.5 months. The CFS score on these inputs is 66.4, a D. That is a rule of thumb, not a verdict on the household. On this net worth calculator the punchline is simple: $285,000 of net worth, but $110,000 of it is the house you live in and only 28.7% of assets pay you anything.
Starting out is $3,000 cash, $8,000 retirement, an $18,000 auto loan, $30,000 of student loans, and $4,000 on cards: assets $11,000, debts $52,000, net worth -$41,000, investable -$23,000. The rental investor chip keeps the default sheet and adds $600,000 of rentals plus $420,000 of rental loans: assets $1,140,000, debts $675,000, net worth $465,000, investable $347,000. Chips are examples, not a forecast.
How to calculate net worth
You calculate net worth by listing assets at sale value, listing debts at the payoff balance, and subtracting. This net worth calculator does that by category so a house cannot hide a small brokerage account. Run the net worth calculator with the same categories each time or the chart becomes a diary.
Price the house and the rentals at what a buyer might pay this season. Price the car at a number you would accept. Leave out furniture unless you would sell it. Count a business at equity, not revenue. Count crypto at a recent price. None of these marks are a promise. On the debt side, a card minimum is not the balance and a HELOC limit is not the balance. The example mortgage is $240,000, so equity is $110,000, not the whole $350,000 house.
Read the ratios before the headline. Debt to assets is 47.22% (full points are 30% or less). The income-producing share is 28.70% (full points are 60%). Liquid coverage is 12.5 months. One strong line does not lift the whole letter.
Liquid, investable, and income-producing net worth
Liquid, investable, and income-producing are three cuts of the same balance sheet. The net worth calculator shows all three because $285,000 can mean three different things. Liquid is what you can reach without selling the house. Investable is what could be put to work once the home, the cars, and the debts that are not those loans are set aside. Income-producing is the slice that is supposed to pay you.
Liquid on this net worth calculator is cash $15,000 plus brokerage $30,000 plus crypto $5,000, or $50,000. Retirement is left out. An early withdrawal can cost a penalty, so it is a poor emergency fund. The emergency fund calculator sizes the cash you actually need on hand. Debts stay off this card. Subtracting every loan yourself would be $50,000 minus $255,000, which is a different question.
Investable net worth starts at $540,000, removes the $350,000 home, the $20,000 of vehicles, and $0 of other assets, then removes debts other than the mortgage and the auto loan. Those other debts are the $3,000 of cards. $540,000 minus $370,000 minus $3,000 is $167,000. The mortgage and the auto loan stay with the assets already removed, so they are not subtracted twice.
Income-producing assets are brokerage $30,000, retirement $120,000, rentals $0, crypto $5,000, and business $0. That is $155,000, or 28.70% of $540,000. The home and the vehicles are wealth. They are not a paycheck. Move crypto to other assets if you do not want a coin that pays nothing inside the share.
The net worth calculator score uses four rules. Debt to assets is 1 at 30% or less and 0 at 80% or more, weight 30. Income-producing share is 1 at 60% or more and 0 at 10% or less, weight 30. Liquid versus six months of spending is the fraction covered, capped at 1, weight 25. Credit cards are 1 at $0 and 0 at $10,000, weight 15. Example points are 19.7, 11.2, 25, and 10.5. The total is 66.4, letter D. It is a rule of thumb.
Net worth by age: 2025 Fed medians
The Federal Reserve's 2025 Survey of Consumer Finances, published in October 2026, puts the median American family at $215,900 of net worth. That's the family in the exact middle. Half have more, half have less, and it's the only fair yardstick, because the average gets yanked to $1.24 million by a small crowd of very wealthy households.
| Age of family head | Median net worth, 2025 | Change since 2022 | Mean net worth, 2025 |
|---|---|---|---|
| Under 35 | $33,000 | -23% | $135,400 |
| 35 to 44 | $155,600 | +5% | $681,900 |
| 45 to 54 | $253,700 | -6% | $1,244,500 |
| 55 to 64 | $411,900 | +3% | $1,878,000 |
| 65 to 74 | $431,300 | -4% | $1,897,600 |
| 75 or older | $504,900 | +37% | $1,962,200 |
| All families | $215,900 | +2% | $1,241,500 |
Source: Federal Reserve, Changes in U.S. Family Finances from 2022 to 2025, table 2, in 2025 dollars.
Two things jump out. Families under 35 lost almost a quarter of their median wealth in three years, which the Fed ties mostly to business equity gains that unwound. And for most families the biggest asset is still the house, which is why this calculator splits investable net worth from the total. The example household's $285,000 beats the 45 to 54 median on paper. Strip out the house and the cars and $167,000 is left to actually work. If your liquid line is thin, size a cushion with the emergency fund calculator before you chase the next bracket.
Track your net worth over time
You track net worth by saving the same sheet on a date, then saving it again later. This net worth calculator stores those snapshots in this browser only. We never see them. A sample series, used only as a chart example and not loaded into your browser, goes from $250,000 on January 1, 2026, to $262,000 on April 1, to $271,500 on July 1, to $285,000 on October 1. The change is $35,000 over 9.00 months, about $3,888.89 a month, or 14.00%.
January 1 to October 1 is 9.00 calendar months. Leftover days, when there are any, are divided by 30.4375. Two dates show the change. Save your first snapshot to start the chart. The same date replaces the older row. Clear all asks before it deletes.
The line draws net worth, liquid assets, and investable net worth from snapshots saved in this browser only. Debts are a vertical bar, one column per balance above zero. The asset mix is a bar, one column per asset above zero. This net worth calculator puts typed numbers into the share link only, never the snapshots. Share that link only with people you trust.
Net worth vs cash flow
Net worth is a stock. Cash flow is a stream. The net worth calculator can show $285,000 while the household still needs a paycheck, because $110,000 of the $285,000 is home equity and only 28.70% of assets are in the income-producing bucket. A paid-off house raises net worth and can lower the bills. It does not, by itself, replace a salary.
Read net worth vs cash flow. When the question is income versus spending, use the financial freedom calculator. Track both scoreboards.
Frequently asked questions
How do I calculate my net worth?
Add what you own, then subtract what you owe. This net worth calculator uses $15,000 cash, $120,000 retirement, $30,000 brokerage, a $350,000 home, $5,000 crypto, and $20,000 of vehicles: $540,000 of assets. Debts are a $240,000 mortgage, $12,000 auto, and $3,000 on cards: $255,000. Net worth is $285,000.
Should I include my home in net worth?
Yes, for the full balance sheet. Home value $350,000 minus the $240,000 mortgage is $110,000 of equity. Net worth excluding that equity is $175,000. This net worth calculator also shows investable net worth of $167,000, which leaves out the house, the cars, and debts other than those two loans.
What is liquid net worth?
On this net worth calculator, liquid is cash plus brokerage plus crypto: $15,000 + $30,000 + $5,000 = $50,000. Debts are not subtracted. Against $4,000 of monthly spending that is 12.5 months. Six months is the score target. Retirement stays out because an early withdrawal can cost a penalty.
What is a good net worth by age?
Compare yourself with the median, not the mean. The Federal Reserve's 2025 Survey of Consumer Finances, released October 2026, puts median family net worth at $33,000 under 35, $155,600 at 35 to 44, $253,700 at 45 to 54, $411,900 at 55 to 64, $431,300 at 65 to 74, and $504,900 at 75 or older. The overall median is $215,900. The means run five to six times higher because a few very rich families drag the average up. The example $285,000 sits above the 45 to 54 median, yet only $167,000 of it is investable.
What is the asset mix chart?
It is a bar for each asset above zero. On the example the bars are cash $15,000, retirement $120,000, brokerage $30,000, home $350,000, crypto $5,000, and vehicles $20,000. Those add to $540,000. Rentals, business, and other assets are $0, so they are not drawn.
How often should I track net worth?
Once a month or once a quarter is enough. A sample series goes from $250,000 on January 1, 2026 to $285,000 on October 1: a $35,000 change over 9 months, about $3,888.89 a month, or 14.00%. This net worth calculator keeps those rows in this browser only.
Is my data saved anywhere?
This net worth calculator saves snapshots in this browser only. We never see them. Export JSON or CSV for a copy you control. A share link puts the numbers you typed into the URL. Share it only with people you trust. Snapshots are never in the URL.
Educational only. Not financial advice. The values are your estimates, and nothing you enter is sent to us.