

Real estate · Every door, one total
Rental Portfolio Tracker
Short answer
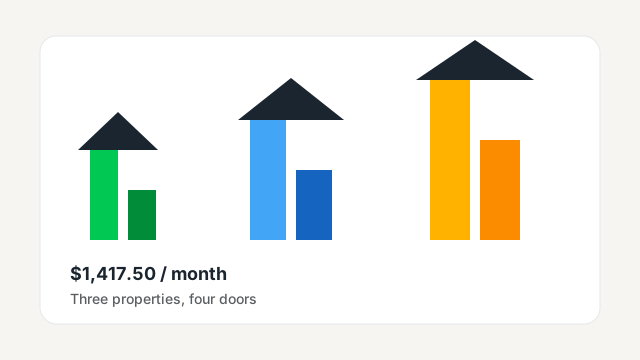
Three properties, four doors, $1,417.50 a month of cash flow, 28% of a $5,000 goal. The paid-off ranch earns the most cash per month but a lower return on the cash tied up in it than the duplex. This rental portfolio tracker keeps the rows in your browser. It is for an owner who wants the monthly total in one place. The caveat: the rows are only as honest as the expenses you type.
Last reviewed: November 2026. Illustration, not a forecast.
Rental portfolio tracker
This rental portfolio tracker adds each property by nickname and rolls rent, expenses, debt, equity, and cash flow into one board. The example is $1,417.50 a month across 4 doors. Saved in this browser only (localStorage). Nothing is uploaded. Educational only. Not financial advice.
How to use this tracker
- Click Load example portfolio if you want the three sample nicknames, or type your own.
- Save property adds the row on screen. Save in this browser writes localStorage.
- Read the P&L: income, expenses, debt, cash flow, DSCR, and equity.
- Move the what-if sliders. The saved dollars do not change.
- Export the saved CSV, or import a file with the same columns. A bad file does not wipe saved rows.
- Save scenarios A and B if you want two what-if cases side by side in this tab.
Example portfolio: 3 properties, 4 doors
The worked example on this rental portfolio tracker is three nicknames, not a real owner. Duplex on Elm (example) has 2 doors, $2,600 rent, $1,150 of principal and interest, and $75,000 invested. Condo (example) has 1 door, $1,650 rent, $720 of principal and interest, a $275 HOA, and $50,000 invested. Paid-off ranch (example) has 1 door, $1,400 rent, no loan, and $150,000 invested. Vacancy is 5% on each. Load example portfolio shows these rows without writing storage.
| Nickname | NOI | Cash flow | CoC | Equity | LTV | Cap | DSCR |
|---|---|---|---|---|---|---|---|
| Duplex on Elm (example) | $1,582.00 | $432.00 | 6.91% | $130,000 | 61.76% | 5.58% | 1.38 |
| Condo (example) | $910.50 | $190.50 | 4.57% | $90,000 | 57.14% | 5.20% | 1.26 |
| Paid-off ranch (example) | $795.00 | $795.00 | 6.36% | $185,000 | 0% | 5.16% | n/a |
| Portfolio | $3,287.50 | $1,417.50 | 6.19% | $405,000 | 44.90% | 1.76 |
Rent totals $5,650. Cash flow is $1,417.50 a month, $17,010 a year, and $354.38 per door. Equity is $405,000. Portfolio LTV is 44.90%. Portfolio cash-on-cash is 6.19%. Portfolio DSCR is 1.76. Against a $5,000 goal that is 28.35% of the way there. The duplex has the best cash-on-cash, 6.91%. The condo is the weakest, 4.57%, even though the ranch ties up more cash. Those three nicknames are the sample board on this rental portfolio tracker until you replace them.
The numbers that matter for a portfolio
A single-deal calculator answers "should I buy this one?" A rental portfolio tracker answers "what do I already own?" NOI is effective rent minus operating costs. Cash flow is NOI minus principal and interest. On the duplex, NOI is $1,582.00 and cash flow is $432.00 after the $1,150 payment. Mix those up and a portfolio looks richer than the checking account.
Cash-on-cash is annual cash flow divided by cash invested. The ranch earns $795.00 a month, the most cash, and 6.36% on $150,000. The duplex earns less cash and 6.91% on $75,000. DSCR is NOI divided by principal and interest. The portfolio figure, 1.76, uses the totals, not an average of the three ratios. The ranch is n/a because a zero payment cannot be a denominator. LTV is total loans divided by total value, 44.90% here, which a single 80% loan would not tell you.
Cap rate is annual NOI divided by value. The three example caps are 5.58%, 5.20%, and 5.16%. The average on the board is the plain mean of those, about 5.31%. It is not a price you should pay for the next house. It is a description of the ones you typed. If value is a guess, equity and cap rate are guesses too. Cash flow still depends on the rent and the bills, which you can check against the bank and the leases. The rental portfolio tracker keeps that description next to the cash that actually hits the account.
Cash flow per door and why it matters
Per door keeps a duplex from looking twice as good just because the rent is higher. This rental portfolio tracker divides $1,417.50 by 4 doors and gets $354.38. The score treats $300 a door as the full-credit line and $0 as none. A fourplex with $400 of cash flow is $100 a door. A house with $400 is $400 a door. Same cash, different workload, different vacancy risk.
Doors are whatever you type. If you enter a duplex as one door, per-door cash flow doubles and the score gets easier. That is on you. Count kitchens, or count leases, but count the same way every time. The years-to-goal sketch then uses average cash flow per property, not per door: one new property like your current average, every two years, until the monthly goal is met. On the example that is 8 more properties and 16 years. It is arithmetic, not a buying schedule. The rental portfolio tracker labels that sketch so it is not mistaken for a purchase plan.
Pay one off or buy another?
The ranch is the picture. No payment, $795.00 a month of cash flow, and 6.36% on the $150,000 still sitting in the house. The duplex, with a loan, makes $432.00 and 6.91% on less cash. Paying a loan off raises monthly cash flow and can lower the return on the cash that remains trapped in equity. Buying another property does the opposite: more debt, more doors, and the cash stays at work only if the next deal clears your screen.
This rental portfolio tracker will not pick for you. Sort the table by cash flow, then by cash-on-cash, and see which property is doing which job. Then read pay off a rental or buy another for the tradeoff in words. A high LTV and a thin DSCR is a different problem from a paid-off house that simply earns a modest return on a large pile of equity.
How many rentals do you need?
Divide the spending you still need by cash flow per door, not by a blog's favorite door count. The example goal is $5,000 and the board is at $1,417.50, so 28.35% of the goal is already on the books. The rest is not "buy three more like the duplex" unless the next duplex really matches. Use how many rentals to retire for the gap math, and from one rental to a portfolio for the pace. The rental portfolio tracker only counts the doors and the cash flow you type.
The what-if sliders are the stress test on the board you have. A rent move of 10% changes every rent and the percent-based expenses that ride on rent. An expense move scales taxes, insurance, HOA, and those percents together. A rate shock scales principal and interest as if a 30-year loan at 7% repriced by the points you pick. That shock is rough. It is not an amortization of your note. If the with-what-if cash flow goes negative, the goal meter was describing a calm year.
Your data stays in your browser
The rental portfolio tracker uses localStorage and says so because that is the whole privacy story. There is no account. Load example portfolio does not save. Save in this browser writes the nicknames and the numbers under a key on this device. Clear all asks first, then deletes that key. Importing a file also waits for Save in this browser.
A shared computer will show the board to the next person who opens the page. Export JSON or CSV and clear the board if that matters. The goal and the three sliders can also live in the page address, so a copied link shares the goal and the what-if, not the property list. Property rows are left out of the URL on purpose. Do not put a street address in the nickname, and do not put one in a file you did not mean to keep.
What the numbers mean
- Income
- Gross rent times one minus the vacancy percent. It is the top line of the P&L, not the cash that clears the loan.
- Expenses
- Management, repairs, and CapEx as percents of gross rent, plus taxes, insurance, and HOA. The loan payment is not an expense on this line.
- Debt
- The principal and interest you typed. The example portfolio debt service is $1,870 a month.
- Cash flow
- What is left after operating costs and the loan payment. The example is $1,417.50 a month, or $17,010 a year.
- DSCR
- NOI divided by principal and interest. It reads n/a when there is no debt. The example portfolio is 1.76. A property with $12,000 of NOI and $10,000 of debt service is 1.20.
- Equity
- Value minus the loan balance. The example total is $405,000. A $300,000 value and a $200,000 loan is $100,000 of equity.
Frequently asked questions
How do I track cash flow on multiple rentals?
Add each rental by nickname on this rental portfolio tracker. Enter rent, principal and interest, taxes, insurance, HOA, and percents for management, vacancy, repairs, and CapEx. The example of three properties produces NOI of $3,287.50 and cash flow of $1,417.50 a month, or $17,010 a year. The P&L table shows income, expenses, debt, cash flow, DSCR, and equity for each nickname, then the sums. Save in this browser if you want the rows to remain. Nothing is uploaded.
What is cash flow per door?
Cash flow per door is total monthly cash flow divided by doors. A duplex counts as two. On this rental portfolio tracker the example has 4 doors and $1,417.50 of cash flow, which is $354.38 per door. The score gives full credit at $300 or more and none at $0 or below. It is a ruler, not a rule from a lender.
What is a good DSCR for a rental portfolio?
A common screen is 1.25: NOI at least 1.25 times the principal and interest. This rental portfolio tracker scores 1.25 as full credit and 1.00 as none. The example portfolio DSCR is 1.76, because total NOI of $3,287.50 covers total principal and interest of $1,870. A paid-off property has no loan, so its DSCR reads n/a and does not drag the portfolio ratio down. A single property with NOI of $12,000 and debt service of $10,000 is a 1.20 DSCR.
Should I track equity or cash flow?
Track both. They answer different questions. The example equity is $405,000 and the portfolio LTV is 44.90%. Cash flow is $1,417.50 a month. The paid-off ranch produces the most cash, $795.00, and the lowest cash-on-cash among the three is the condo at 4.57%. Equity is value minus the loan. A $300,000 value and a $200,000 loan is $100,000 of equity. Equity is not spendable until you sell or refinance.
Is my data saved online?
No. This rental portfolio tracker keeps rows in localStorage on this browser under the existing cfs-rentals key. Load example does not write storage. Click Save in this browser when you want the list kept. Clear all deletes that saved board after you confirm. Another browser, or a cleared site-data setting, will not have the rows.
Can I export to a spreadsheet?
Yes. The toolbar CSV downloads the properties already saved in this browser. Columns are nickname, doors, rent, principal and interest, taxes, insurance, HOA, the four percents, value, loan, and cash invested. Import reads those same columns and adds rows on screen. A bad file shows a short error and does not wipe saved rows. Nothing is sent to a server. Click Save in this browser if you want the new rows kept.
Educational only. Not financial advice. Numbers are what you enter. Saved in this browser only.