

Crypto · what the buys actually cost
Crypto DCA Calculator
Short answer
Dollar-cost averaging (DCA) means buying the same dollar amount on a schedule, whatever the price. It lowers your average cost when prices bounce around and loses to a lump sum when prices only climb. In our made-up bumpy year, $100 a month bought coins at a $50,740 average cost and ended up 26.1%, while the same $1,200 dropped in on day one gained 5.6%. Paste your own prices to see your real number.
Last reviewed: November 18, 2026, when bitcoin traded near $62,700 (CoinGecko). Example prices are illustrations, not a forecast.
Crypto DCA calculator
This crypto DCA calculator answers what a fixed dollar buy actually cost, and whether a lump sum on the same prices did better. It is for someone who will paste their own prices. There is no live feed. The default list is example data, not real history. The honest catch: one bumpy year is not a law. Educational only. Not financial advice.
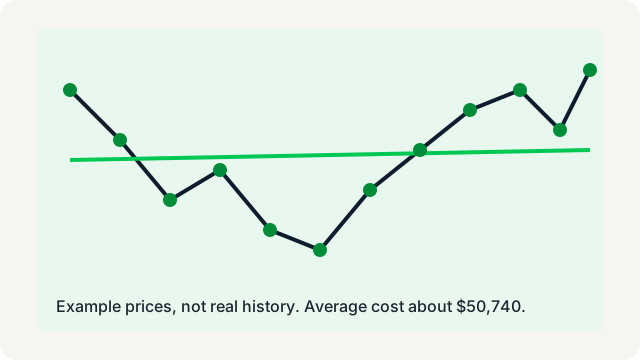
This crypto DCA calculator is an illustration. If the list is not 2 to 120 prices above zero, the page says so instead of printing a broken number. Example prices are made up. Crypto can lose most of its value. Lump sum uses the first price on the same path. With the box empty, that path is the example list.
How to use this calculator
- Leave the price box empty, or paste your own monthly prices (CSV). Empty uses the example list.
- Set the dollars per buy and the fee. The frequency label only names the rows.
- Leave current price blank to use the last price, or type the one you care about.
- Read average cost next to the simple average price, then the lump-sum gain.
- Try Steady climb. If lump sum wins there, that is the other half of the story.
- Use Build pattern when you want a start, an end, and a swing instead of typing every price.
What the numbers mean
- Average cost
- $50,739.98 on the example. Cash you put in, divided by coins you got. Fees sit in that cash.
- Average price
- $51,500.00. Add the prices and divide by how many there are. Coins do not enter this one.
- Lump sum
- The same $1,200.00 bought at the first price, same 1% fee: 0.01980000 coins.
- Worst point
- The deepest paper loss along the way: -$101.99 on the example list. Green at the end does not erase that dip.
Worked example: $100 a month for 12 months
The default on this crypto DCA calculator is $100 a buy, a monthly label, a 1% fee, and 12 example prices from 60,000 down through 39,000 and back to 64,000. Invested cash is $1,200.00. Fees are $12.00. Coins are 0.02364999. Average cost is $50,739.98. The simple average price is $51,500.00. At $64,000 the coins are worth $1,513.60. Gain is $313.60, or 26.13%.
The lump sum puts all $1,200.00 in at 60,000. After the same 1% fee that is 0.01980000 coins, worth $1,267.20 at 64,000, a 5.60% gain. DCA won in this made-up bumpy year because the dips handed out more coins. That is the whole trick, and it is not a law.
The worst paper loss along those buys is -$101.99. You were down on paper even though the ending picture is green. If you needed the cash at the low, the plan did not care. A typed current price of $50,000 marks the same coins at $1,182.50, which is -1.46%. Fee at 0% buys 0.02388888 coins. Same path. Slightly more coin. It's a sketch you can replace, not a backtest of a real market.
How dollar-cost averaging works
You decide the dollars first. The price decides the coins. A $100 buy at 39,000 gets more coin than a $100 buy at 64,000. Add them up and you own a pile that was cheap to acquire if you bought the dips, and expensive if you bought the spikes. The calculator does that division for every row and then adds it up.
The schedule is the discipline. Weekly, biweekly, or monthly is a name on the row. It does not change the formula. What changes the formula is the price list and the fee. If you skip a buy because the price "looks high," you are no longer averaging. You are guessing. Guessing can win. It is a different plan, and this page will not pretend it is the same plan.
People like DCA because it gives a job to do on a boring day. That is useful if the alternative is dumping rent money in after a headline. It is not useful if the asset can go to zero and you needed the cash for a bill. Crypto can lose most of its value. A neat average cost does not put a floor under it.
Paste a real fill if you have one. The chips are toys for the shape of a year: bumpy, a steady climb from 30,000 to 60,000, a crash from 60,000 to 25,000 and back toward 55,000, or a sideways wiggle near 50,000. All of those are example data. None of them is a forecast. The math works the same on any of them.
Average cost vs average price
Average price is the simple mean: add the prices, divide by the count. On the example that is $51,500.00. Average cost is the cash you actually spent divided by the coins you actually got, $50,739.98. Before fees, average cost is the harmonic mean of the prices, which is always at or below the simple mean. Fees push average cost up a little, because you paid for coins you did not receive.
The gap is the point of buying dips. Low prices contribute more coins per dollar, so they pull the cost down harder than they pull a simple average. A high price still hurts, but it hurts the simple mean as much as the cost, while adding fewer coins. If every price is the same, the two numbers meet, and the fee is the only wedge.
Do not brag about a low average cost if the current price is lower still. Cost is history. Value is the price now. This tool puts them on one row so the history can't hide the mark. At $50,000 the example pile is under water even with that $50,739.98 cost. The dips were not deep enough to survive a $50,000 mark.
Count the buys under the average cost if you want a plain scoreboard. It is not a grade. It is just how many of your prices beat the cost you ended up with. A list that only climbs will show few of those, and the lump sum will usually look smarter. Honest tools say both.
DCA vs lump sum
Lump sum here means the full $1,200.00 goes in at the first price, with the same fee. On the example that is a worse ending than the monthly buys, 5.60% versus 26.13%. DCA won in this made-up bumpy year. The first price was near the high. The later dips did the work. If your first price is the low, the story flips.
In a straight-up market, lump sum usually wins. Cash that waits in the checking account for the next buy misses the rise. The Steady climb chip is there so you can watch lump sum take the lead without anyone pretending the bumpy example is the only market. Try both shapes before you pick a personality.
There is a third outcome people skip: you needed the money in the middle. The worst point on the example is -$101.99. That is the deepest gap between value-so-far and cash-in-so-far. It is a paper loss. It becomes a real loss if you sell there, and it becomes a crisis if that cash was rent. A plan that cannot sit through its own worst point is a wish.
Neither path is safer because the spreadsheet ends in green. Both can go to zero if the coin does. The comparison is only about when you bought, not about whether you should have bought. There's no "do not buy" button here. You are the button.
Fees eat small buys
A 1% fee on $100 is $1. On twelve buys it is $12.00, which is 1% of the $1,200.00 you invested. Fee drag on this crypto DCA calculator is that percent. It looks small until the buy is small and the fee is a flat network charge instead of a percent. A $5 fee on a $100 buy is not 1%. It is a different plan. Type the percent that matches your real cost, or raise the buy until the flat fee is boring.
Turn the fee to zero and the example buys 0.02388888 coins instead of 0.02364999. The difference is the commission you paid the pipe. It does not show up as a line item in your coin balance. It shows up as coins you never received. That is why average cost uses cash in, not cash after a story you tell yourself.
The heatmap crosses a fee of 0%, 0.5%, 1%, and 2% with a current price from 0.6 times the last price to 1.4 times. A higher fee cannot rescue a lower mark, and a rally can hide a fee that will matter the next time you buy. Read the cell, then decide if the buy size is large enough to carry it.
Spreads count too. If the price you type is already the price after a wide spread, do not add a fee on top unless you also paid one. Double-counting makes the result look harsher than your fills. Under-counting makes it look like a toy. Match the list to what you paid.
DCA is not cash flow
Buying coins on a schedule spends cash. It does not send cash home. Cash flow is what you can spend after fees and taxes. A lower average cost is a purchase story. It becomes household money only when you sell, and selling is a new decision with its own price. This page stops at the coins and the mark. It doesn't pay a bill.
If the coins also stake, that is a second plan. Rewards are more coins, or sometimes a token you can sell, and the price can still erase them. Run that rate in the staking calculator after you know how many coins the buys created. Do not add a staking APR on top of a DCA gain and call the sum income.
Track what you really received. The crypto cash-flow tracking guide is about writing down cash that hit an account, not paper gains. A green cell here is paper until you sell. Paper is allowed. Spending it is not.
Keep the sleeve small enough that a blank year does not change your rent. The worst point is the rehearsal. If -$101.99 on a $1,200 sketch makes you nervous, a larger account will feel worse, not calmer. Size the buy so the schedule survives a dull stretch.
Plan the exit before you need it
Most DCA plans are careful on the way in and improvised on the way out. People buy $100 every month for three years with monk-like discipline, then watch a 3x run with no plan at all and ride it straight back down. The fix is boring and works: write down the prices where you'll sell a small slice, before the price gets there.
The crypto take-profit calculator builds that ladder from your average cost, shows the tax on each sale, and tests it against holding through a 75% crash. Get your average cost from this page first, or from the cost basis calculator if your buys live on three exchanges.
DCA FAQ
What is dollar-cost averaging in crypto?
You buy a fixed dollar amount on a schedule, no matter the price. On this crypto DCA calculator, $100 a month for 12 example prices puts in $1,200.00, pays $12.00 in fees, and receives 0.02364999 coins. The schedule does not know the future. It only splits the cash.
Is DCA better than a lump sum?
Not as a rule. In this made-up bumpy year, DCA gained 26.13% and a lump sum at the first price gained 5.60%. The lump sum bought 0.01980000 coins and is worth $1,267.20 at $64,000, against $1,513.60 for the monthly buys. In a straight-up market, lump sum usually wins, because the early price was the cheap one. This crypto DCA calculator will show that if you paste a climbing list.
How do I calculate my average cost?
Divide the cash you invested by the coins you received. Fees stay in the cash and come out of the coins. Here that is $1,200.00 / 0.02364999 = $50,739.98. The simple average of the prices is $51,500.00. Average cost is the harmonic mean, so it sits at or below that simple mean before fees. This crypto DCA calculator prints both.
How often should I DCA?
Weekly, biweekly, or monthly changes the row labels, not the math. Twelve prices are twelve buys whether you call them months or weeks. Pick a rhythm you will actually keep. The crypto DCA calculator does not pick a payday for you. Fees and the prices you type matter more than the label.
Do fees matter for DCA?
Yes, more on small buys. A 1% fee on $1,200.00 is $12.00, which is the whole fee drag. At a 0% fee the same prices buy 0.02388888 coins instead of 0.02364999. A flat fee that looks tiny on a large order is a real slice of a $100 buy. The crypto DCA calculator shows fee drag as a percent of invested cash.
Where do these prices come from?
They are example data, not real history, and not a quote for any coin. The list is 60000, 52000, 45000, 48000, 41000, 39000, 44000, 50000, 58000, 62000, 55000, 64000. Replace it. At a typed current price of $50,000 the same coins are worth $1,182.50, a -1.46% result. The crypto DCA calculator never fetches a live price.
Should I dollar-cost average out of crypto too?
Many people do. Selling a fixed slice at set price targets, a take-profit ladder, is the mirror image of DCA: you never hit the exact top, but you never ride the whole stack back down either. Each sale is taxable, at long-term rates of 0%, 15%, or 20% if you held over a year. The crypto take-profit calculator builds the ladder and shows the tax on each rung.
How do I paste my own monthly prices?
Paste your own monthly prices (CSV) into the price box. Commas or new lines both work. Leave the box empty and the calculator uses the same example list as before, so the hero does not move. Nothing is uploaded. There is no price feed and the page does not invent a history.
Educational only. Not financial advice. Example prices are made up. Crypto can lose most of its value, and a green ending does not mean you were never down.