

Housing · When buying pulls ahead
Rent vs Buy Calculator
Short answer
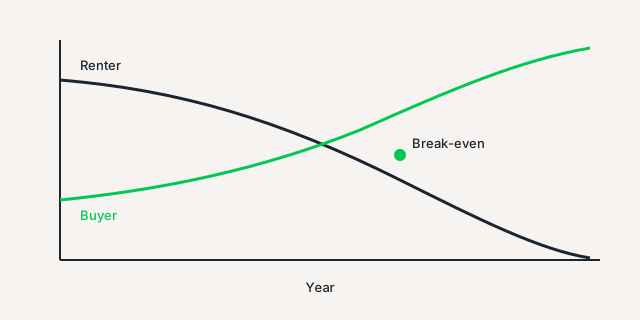
This rent vs buy calculator runs a net-worth race for someone choosing a home to live in, not a rental that pays rent. A $400,000 house at 7.18% (example rate) costs $3,017.79 to own in month 1. Renting at $2,200 plus $15 of insurance costs $2,215.00, so buying costs $802.79 more that first month. If the renter invests the gap, and both sides earn 6% on invested cash, buying pulls ahead in year 20. In year 10 the renter is still ahead by $37,470.07. In year 30 the buyer is ahead by $145,445.15. The page always runs 30 years. The slider only picks which year the cards highlight, and the race falls apart if the renter spends the gap.
Rates this week: Freddie Mac's 30-year average hit 7.28% on November 19, 2026, up from 7.11% a week earlier and 6.26% a year ago. The calculator still opens at the November 5 figure of 7.18% so the worked example below stays consistent. Type 7.28 and the break-even slides from year 20 to year 21. Better yet, type the rate from your own lender quote.
Last reviewed: November 19, 2026. Illustration, not a forecast.
Rent vs buy calculator
Same life, two paths. Whoever spends less each month invests the difference. The break-even year is the first year the buyer net worth is at least the renter net worth. Home values and investment returns can fall. Example rates, not offers. Educational only. Not financial advice.
The Cash Flow Scout
Rent vs Buy Calculator
Educational only. Not financial advice. Illustration, not a forecast.
Who is ahead
Break-even year
Year 20
Break-even year: Year 20. Buying beats renting after year 20 at these numbers.
Selling costs at year 10: $32,253.99. Already removed inside equity, not subtracted again.
Opportunity cost of the down payment at year 10: $131,760.76. Down payment grown at 5% a year. Shown beside the race. The winner ignores it until you check the box.
Deduction used: $16,100. 2026 standard deduction for single. Housing does not change the published result while the toggle stays on standard.
Housing tax benefit, month 1 (annualized): $0. Zero while you take the standard deduction. Illustration, not tax advice.
Price-to-rent ratio: 15.2. Under about 15 tends to favor buying. Over about 20 tends to favor renting. Rule of thumb only.
Educational only. Not financial advice. Illustration, not a forecast. The published race ignores income taxes. A tax on investment gains would trim the renter. The deduction toggle is an illustration, not tax advice.
Net worth by year
| Year | Home value | Loan | Equity after sale | Buyer invested | Renter invested | Buyer net worth | Renter net worth | Buyer minus renter |
|---|---|---|---|---|---|---|---|---|
| 1 | $412,000.00 | $316,860.52 | $70,419.48 | $0.00 | $107,577.24 | $70,419.48 | $107,577.24 | -$37,157.77 |
| 5 | $463,709.63 | $301,793.38 | $134,093.67 | $0.00 | $174,026.66 | $134,093.67 | $174,026.66 | -$39,932.99 |
| 7 | $491,949.55 | $292,478.93 | $169,953.64 | $0.00 | $209,852.92 | $169,953.64 | $209,852.92 | -$39,899.27 |
| 10 | $537,566.55 | $275,751.26 | $229,561.30 | $0.00 | $267,031.38 | $229,561.30 | $267,031.38 | -$37,470.07 |
| 15 | $623,186.97 | $238,501.49 | $347,294.26 | $0.00 | $372,034.74 | $347,294.26 | $372,034.74 | -$24,740.47 |
| 20 | $722,444.49 | $185,220.69 | $493,877.13 | $11,853.17 | $501,819.11 | $505,730.31 | $501,819.11 | $3,911.20 |
| 30 | $970,904.99 | $0.00 | $912,650.69 | $145,802.51 | $913,008.05 | $1,058,453.20 | $913,008.05 | $145,445.15 |
One change at a time
| Change | Break-even year |
|---|---|
| Appreciation -1 | Year 29 |
| Appreciation +1 | Year 9 |
| Rent -$400 | Not within 30 years |
| Rent +$400 | Year 7 |
| Return -2 | Year 10 |
| Return +2 | Not within 30 years |
| Rate -1 | Year 10 |
| Rate +1 | Not within 30 years |
How to use this calculator
- Enter the home price, the down payment, and an example rate, then set the years you plan to stay.
- Set rent, rent growth, and the return you would actually earn on cash you invest. Hope is not a return.
- Read the break-even year. That is the first year buyer net worth is at least renter net worth.
- Check the selling-cost line and the opportunity-cost line. They are labeled so you can see the dollars without counting them twice.
- Leave the deduction toggle on standard if you want the published comparison. Choose itemized only when you want the housing tax illustration.
- Save scenario A and B, copy the link, or download the CSV. The link leaves default inputs off, so an old share still opens the same hero.
What the numbers mean
- Break-even year
- The first year buyer net worth is at least renter net worth. On the defaults that is year 20. The headline uses that same year. It does not run a second formula behind your back.
- Buyer net worth
- Home equity after selling costs, plus any cash the buyer invested because owning was cheaper that month. At year 10 on the defaults, invested cash is still $0 and net worth is $229,561.30.
- Renter net worth
- The invested account. It starts with the down payment plus buy closing costs, then grows, then receives the monthly gap. Year 10 on the defaults is $267,031.38.
- Selling costs
- The selling-cost percent times the year-end value. Year 10 is $32,253.99. Equity already had this taken out, so the line is not subtracted again.
- Opportunity cost
- The down payment compounded monthly at the opportunity rate, default 5%. Year 10 is $131,760.76. It sits beside the race unless you check the box.
- Price-to-rent ratio
- Price divided by one year of rent. $400,000 divided by $26,400 is 15.2. A rough screen, not the break-even year.
- Housing tax benefit
- Zero on the standard deduction. If you itemize, it is the excess of mortgage interest plus property tax over the 2026 standard deduction, times the marginal rate. Illustration, not tax advice.
Worked example: $400,000 house vs $2,200 rent
Down payment is 20%, so $80,000, and the loan starts at $320,000. Principal and interest is $2,167.79. Tax at 1.1% is $366.67 a month on the starting price. Insurance is $150. Maintenance at 1% is $333.33. Month-1 cost to own is $3,017.79. Rent plus $180 a year of insurance is $2,215.00. The gap is $802.79, about $803.
The renter account starts at $92,000 (down payment plus 3% buy closing) before month 1 grows it. Each month both accounts grow by 6% / 12, then the cheaper side deposits the gap. Home value and rent step up once a year, at months 13, 25, and 37. Costs during year Y use the prior year value. The table home value is the year-end figure, price times (1.03) to the year.
| Year | Home value | Loan | Buyer net worth | Renter net worth | Difference |
|---|---|---|---|---|---|
| 1 | $412,000.00 | $316,860.52 | $70,419.48 | $107,577.24 | -$37,157.77 |
| 5 | $463,709.63 | $301,793.38 | $134,093.67 | $174,026.66 | -$39,932.99 |
| 10 | $537,566.55 | $275,751.26 | $229,561.30 | $267,031.38 | -$37,470.07 |
| 15 | $623,186.97 | $238,501.49 | $347,294.26 | $372,034.74 | -$24,740.47 |
| 20 | $722,444.49 | $185,220.69 | $505,730.31 | $501,819.11 | $3,911.20 |
| 30 | $970,904.99 | $0.00 | $1,058,453.20 | $913,008.05 | $145,445.15 |
Year 20 is the first year the buyer is ahead. The loan is not gone until year 30. Equity in the table is the year-end value after 6% selling costs, minus the loan. Buyer invested cash stays $0 until owning finally costs less than renting, which happens between year 15 and year 20 on this path.
Two extra lines sit beside that race. Selling costs in year 10 are $32,253.99, and they are already inside the $229,561.30 of equity. The opportunity-cost line grows the $80,000 down payment at 5% and reaches $131,760.76 in year 10. Leave the box unchecked and that line does not move the winner.
How the rent vs buy comparison works
Both people spend the same total when you count the invested gap. The buyer pays the mortgage, tax, insurance, maintenance, and HOA. The renter pays rent and renters insurance. The difference is deposited with whoever spent less, after both accounts have grown for the month.
Selling costs come off the home before equity is counted, every year, as if you sold that December. That keeps a paper gain from pretending to be cash. The loan balance charges interest on the start-of-month balance, then takes the payment. A balance under half a cent is treated as zero on the display. The loop always runs 360 months so a late break-even still shows up.
What changes the answer
The default break-even is year 20. One input, moved by itself, can pull that year forward or push it past the 30-year window. These are the same nudges the table above the fold recalculates.
- Appreciation 2% (one point lower): break-even year 29. At year 10 the buyer is behind by $79,224.53.
- Appreciation 4%: break-even year 9. At year 10 the buyer is ahead by $8,303.85.
- Rent $2,600: break-even year 7. At year 10 the buyer is ahead by $36,592.08.
- Rent $1,800: renting stays ahead for all 30 years.
- Invested-cash return 8%: not within 30 years. At year 10 the buyer is behind by $87,362.39. A higher return helps the person holding the bigger invested pile, which is the renter for a long time.
- Invested-cash return 4%: break-even year 10.
- Rate 6.18%: break-even year 10. At year 10 the buyer is ahead by $3,959.98.
- Rate 8.18%: not within 30 years.
The same house at real 2026 rates
| 30-year rate | When | Own, month 1 | Buying pulls ahead |
|---|---|---|---|
| 6.26% | Freddie Mac, Nov 20, 2025 | $2,822.38 | Year 10 |
| 7.18% | Freddie Mac, Nov 5, 2026 (calculator default) | $3,017.79 | Year 20 |
| 7.28% | Freddie Mac, Nov 19, 2026 | $3,039.48 | Year 21 |
| 8.28% | One point worse than today | $3,260.81 | Never within 30 years |
Look at that first row. One year and one point of rate split the answer from "buy if you'll stay a decade" to "buy only if you'll stay two." Rates come from the Freddie Mac Primary Mortgage Market Survey, which assumes 20% down and excellent credit, so your own quote may run higher.
Appreciation and rent growth step once a year. They do not compound inside the year. A 3% illustration is not a promise that houses or rents do that. Home values can fall. The appreciation input accepts a negative number for that reason.
Price-to-rent ratio: the 10-second check
Divide the price by one year of rent. $400,000 divided by $26,400 is 15.2. Under about 15, buying often looks cheaper on this rough screen. Over about 20, renting often does. Between them, you need the rest of the model.
The ratio does not know your rate, your tax bill, or whether you will actually invest the gap. A 15.2 reading next to a year-20 break-even is the whole lesson: the 10-second check and the 30-year check can disagree on timing even when they rhyme. Use the ratio to decide whether the long table is worth opening.
Renting and investing the difference (only works if you do it)
The renter in this rent vs buy calculator does not blow the $802.79. It lands in an account that also started with the cash the buyer tied up at closing. That is why the renter can be "ahead" while paying a landlord.
If the gap goes to dinners, the renter net worth line is just the starting $92,000 growing at 6%, with no monthly add, and buyer equity is no longer racing a funded account. The model will not police that. It only shows the race you run. Year 1 already has the renter at $107,577.24 against the buyer at $70,419.48, and almost all of that lead is the invested down payment plus one year of gaps.
Buying as a cash flow investor
This page models a home you live in. The house does not send you rent. Its job in the math is equity after a sale, minus what the renter did with the cash you did not invest. That is a net worth race, not a cash flow race.
House hacking flips the comparison because a roommate or a second unit can pay part of the mortgage. The primary home, lived in alone, is still not a cash flow asset. Read how house hacking changes the rent and why net worth and cash flow answer different questions. A rental you do not live in belongs on the cash-on-cash calculator, not in this break-even year.
Frequently asked questions
Is it better to rent or buy in 2026?
At the example numbers, renting has the higher net worth until year 20. A $400,000 house at 7.18% costs $3,017.79 in month 1. Renting the same life at $2,200 plus $15 of renters insurance costs $2,215.00. The $802.79 gap gets invested. Buying pulls ahead in year 20, by $3,911.20, and by $145,445.15 in year 30. Change appreciation, rent, or the rate and that year moves. This rent vs buy calculator is an illustration, not a forecast.
How do higher mortgage rates change rent vs buy?
Every point matters more than it looks. Freddie Mac's 30-year average was 7.28% on November 19, 2026, up from 6.26% a year earlier. At 7.28% the example home costs $3,039.48 to own in month 1 and buying does not pull ahead until year 21. At 6.26% the same house costs $2,822.38 and breaks even in year 10. At 8.28% renting stays ahead for all 30 years. Shop several lenders before you decide, because the rate you get can move the answer by a decade.
How long do you need to stay to make buying worth it?
In the default case, through year 20. Leave in year 10 and the buyer's net worth is $229,561.30 against the renter's $267,031.38, a $37,470.07 gap the other way. Selling costs are 6% of the year-end value, taken before equity counts. A shorter stay has less time for the loan to shrink and for the house to appreciate.
Is renting throwing money away?
Only if you spend the gap. Here the renter starts with the buyer's down payment plus buy closing costs ($80,000 plus 3%, or $92,000) and adds the monthly difference. By year 10 that account is $267,031.38. Rent paid a landlord. The invested gap paid the renter. Skip the investing and the comparison is no longer this comparison.
What is a good price-to-rent ratio?
Price divided by a year of rent. $400,000 / ($2,200 x 12) is 15.2. Under about 15 tends to favor buying. Over about 20 tends to favor renting. It ignores rates, taxes, and whether you invest the gap. Use it as a 10-second screen, then read the year table.
Does this include the mortgage interest deduction?
Not in the published result. Leave the deduction toggle on standard and mortgage interest does not change the break-even year. Switch to itemized and the illustration counts a federal benefit only when mortgage interest plus property tax exceed the 2026 standard deduction for your filing status. The benefit is that excess times the marginal rate. It is an illustration, not tax advice. PMI, moving costs, and taxes on the investment accounts are still left out.
Should I buy a house or invest in rentals first?
A primary home in this model is a place to live that might build equity. It does not pay you a rent check. A rental is a cash flow question, and house hacking mixes the two. Read the house hacking cash flow guide and the net worth versus cash flow page before you treat a residence as a paycheck replacement. Compare loan shapes on the mortgage comparison calculator.
What is the opportunity cost line?
It is the down payment grown at 5% a year, compounded monthly, as if that cash had been invested on its own. At the defaults that balance is $131,760.76 in year 10. The published winner does not add it on top of the renter account, because that account already holds the down payment at the investment return. Check the box to swap that slice to the 5% rate. It is still not counted twice.
Are selling costs counted twice?
No. Equity is the year-end value after the selling-cost percent, minus the loan. The selling-cost line shows those dollars so you can see them. On the default year 10 that is $32,253.99, and it is already inside the equity figure.
More free loan and debt tools: 15 vs 30 year mortgage, DSCR loan, HELOC, debt snowball, cash-out refinance. See the full loans and debt list.
Educational only. Not financial advice. Home values and investment returns can fall, and the renter only wins this race by investing the gap. PMI and moving costs are not included. The published comparison does not apply a tax benefit. The deduction toggle is an illustration, not tax advice. Example rates, not offers.