

Dividends · Which months come in thin
Monthly Dividend Calendar Planner
Short answer
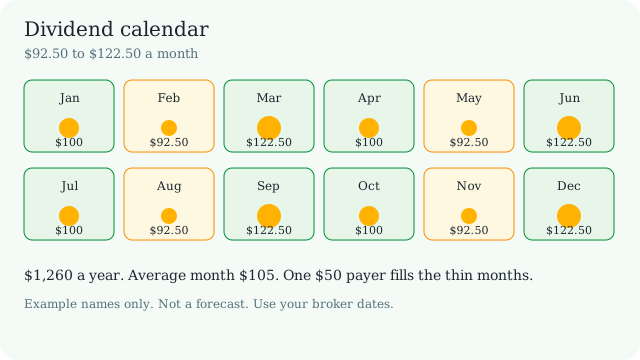
$1,260 a year of dividends lands as $92.50 to $122.50 a month. One more $50-a-year payer on the February, May, August, and November schedule makes every month at least $105. This dividend calendar keeps the rows in the browser. It is for someone who wants to see the thin months before they plan a bill. The caveat: pay dates slip, so use your broker's dates.
Last reviewed: November 2026. Illustration, not a forecast. Use your broker dates.
Dividend calendar planner
This dividend calendar places each holding into the months you choose and adds the month. The example is $1,260 a year, $105 on average, with a thin month of $92.50 and a fat month of $122.50. Saved in this browser only (localStorage). Nothing is uploaded. Educational only. Not financial advice. Dividends can change or stop.
The score is a ruler. Smoothness is lowest month divided by highest month, weight 40. Months at the goal, out of 12, weight 30. Holding count rises from 0.2 at one or two names toward 1 at ten names, weight 20. The largest holding is full credit at 20% of income or less and none at 60% or more, weight 10. Four example names and a 38% top holding do not get a high score, and that is the point of the ruler.
Example: four holdings, $1,260 a year
The worked example on this dividend calendar is four nicknames, not a portfolio anyone owns. Dividend ETF A (example) is 300 shares at $1.10 a year, paid March, June, September, and December: $330 a year, $82.50 a quarter. Utility B (example) is 80 shares at $3.00, paid January, April, July, and October: $240 a year, $60 a quarter. Consumer C (example) is 50 shares at $4.20, paid February, May, August, and November: $210 a year, $52.50 a quarter. Monthly REIT D (example) is 150 shares at $3.20, paid every month: $480 a year, $40 a month. Load example shows these rows without writing storage.
| Month | Gross | Month | Gross |
|---|---|---|---|
| Jan | $100.00 | Jul | $100.00 |
| Feb | $92.50 | Aug | $92.50 |
| Mar | $122.50 | Sep | $122.50 |
| Apr | $100.00 | Oct | $100.00 |
| May | $92.50 | Nov | $92.50 |
| Jun | $122.50 | Dec | $122.50 |
January is the utility $60 plus the monthly $40. February is the consumer $52.50 plus $40. March is the ETF $82.50 plus $40. The year repeats that trio. Annual income is $1,260. The average month is $105. The low is $92.50. The high is $122.50. Smoothness is 75.51%. Pay events are 24. The largest single check is $82.50. The REIT is the top share, about 38% of the year. Against a $150 goal, zero months qualify and the shortfall is $540.
How dividend payment schedules work
A dividend calendar is a map of when cash might show up, not a record of when it did. Most US companies that pay quarterly pick one of three rhythms. Some funds pay every month. A few pay twice a year or once. The planner splits the annual dividend you typed by the number of pay months. It does not invent a raise, a cut, or a special dividend.
The ex-dividend date decides who is the owner of record for that payment. Buy after that date and the next check usually goes to the seller. The pay date is later, sometimes by a few weeks. Those two dates are why a January announcement can become a February deposit. This dividend calendar lets you put the amount in the month you expect the cash. If the broker pays on a different day, change the month. Do not treat the grid as an exchange calendar.
Semiannual and annual schedules use the two month boxes. Pick June and December, or only December. If both boxes match, the second month moves so the two payments are not the same day. Quarterly patterns ignore those boxes. That keeps a March payer from accidentally becoming a June payer because a leftover month was still selected.
Building a dividend paycheck for every month
A paycheck is even. Dividend cash is often not. The example average is $105, but four months are $92.50 and four months are $122.50. If the bills are $105 every month, the fat months do not automatically cover the thin ones unless the extra was saved. Smoothness, lowest divided by highest, is 75.51% here. A board of only March payers would look wonderful in March and empty in February, and the smoothness number would say so.
The holding count is the other half of a paycheck plan. One name that pays every month is still one decision. The score gives a little credit at one or two holdings, half credit around five, and full credit at ten. That is a concentration ruler, not a requirement to own ten funds. The example has four names, so that part of the score sits between the two-name floor and the five-name mark. The top-share ruler wants the largest name at 20% or less and gives nothing at 60% or more. The example REIT at about 38% is in the middle of that slide.
None of this says a monthly payer is a better investment. It says the calendar is easier to live on when more than one schedule is present and no single check is the whole month. Pair the grid with a reading of payout ratios and the business. The dividend calendar will happily draw a smooth year from numbers that a company cannot keep paying.
Filling the thin months
Lift the low months to the average before chasing a goal that none of them reach. On the example the low is $92.50 and the average is $105, a gap of $12.50. A new holding on the February, May, August, and November pattern pays four times, so the annual dividend that fills the gap is $12.50 times 4, which is $50. Each of those months becomes $105. The other patterns do not need that same $50. January and its cousins are already $100, so $5 a month, $20 a year, brings them to the average. March and its cousins are already $122.50, so that pattern needs $0 to reach the average.
The goal is a different question. At $150 a month the example is short every month. The extra annual dividends are the sum of each shortfall: 12 times $150 minus $1,260, which is $540. Drop the goal to $100 and eight months already qualify. The four thin months are $7.50 short each, so $30 a year closes that smaller goal. The dividend calendar shows both the pattern filler and the goal shortfall so the $50 idea is not confused with the $540 idea.
A filler holding is still a holding. It can cut the dividend, and then the thin months come back. The $50 figure is arithmetic on the numbers currently typed. It is not a shopping list. The dividend calendar will redo the arithmetic when the shares or the schedule change.
Track what actually arrives
The plan and the deposit are different documents. Announced amounts, withholding, and a pay date that slips into the next month will not match the grid. Once a month, write down the cash that landed. How to track dividend payments is the paper method. The dividend tracker is a scout list of kings, aristocrats, and ETFs, not this private dividend calendar.
Use the dividend calendar to decide which months you hope will pay, then use the log to see which months did. If February keeps arriving in March, move the holding to March. The goal and the tax percent can live in the page address. The holdings stay out of the link on purpose. A copied link shares the goal, not the share counts.
Dividend calendar FAQ
How do I get dividend income every month?
Use a dividend calendar and spread holdings across more than one payment schedule. The example pays $1,260 a year, from $92.50 in the thin months to $122.50 in the fat months. Four holdings produce 24 pay events. A monthly payer covers every month with a small slice. Quarterly payers cover four months each. The mix is what makes a month, not a promise that any dividend continues.
What months do quarterly dividends pay?
This dividend calendar uses three quarterly patterns: January, April, July, and October; February, May, August, and November; March, June, September, and December. The example puts one holding on each pattern. A quarterly holding pays one fourth of the annual dividend in each of those four months. The month is a planning bucket. The real pay date comes from the broker.
Are monthly dividend stocks better?
A monthly schedule is smoother, not safer. On this dividend calendar the example monthly holding pays $40 a month, which is $480 a year and about 38% of the $1,260 total. The quarterly ETF pays $82.50 four times. Monthly income can still be cut, skipped, or paid as a return of capital. Read the payout and the business. Do not pick a holding only because the calendar looks even.
What is the difference between the ex-dividend date and the pay date?
The ex-dividend date is the cutoff for which owner receives the next dividend. The pay date is when the cash is sent. This dividend calendar does not look up either date. It only places the annual amount into the months you choose. Use the broker statement for the real day, and log the deposit that actually arrives.
Is my data saved online?
No. This dividend calendar keeps rows in localStorage on this browser. Load example does not write storage. Click Save in this browser when the list should remain. Clear all deletes that saved board after a confirm. Export CSV or JSON if a file is useful. Another browser, or a cleared site-data setting, will not have the rows.
How do I fill gaps in my dividend calendar?
Find the thin months and add a payer on that quarterly pattern. On the example, February, May, August, and November are $92.50 and the average month is $105. A new payer of $50 a year on that pattern adds $12.50 to each of those four months and lifts them to $105. The $150 goal still needs $540 more across the year, because no example month reaches $150 yet.
Educational only. Not financial advice. Dividends can change or stop. Amounts and dates are what you enter.