

Dividends · Spend it, or buy more shares
DRIP Calculator: Dividend Reinvestment
Short answer
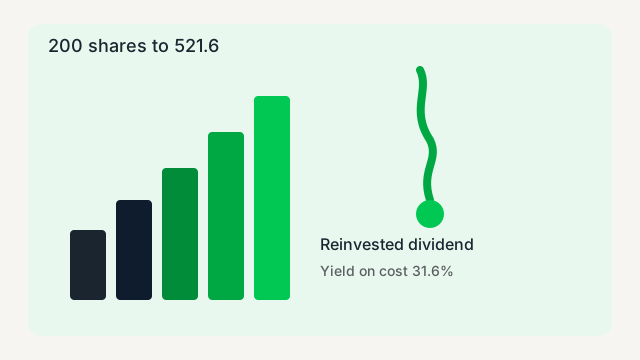
Reinvesting turns 200 shares into 521.6 shares over 20 years and lifts the yield on your original $10,000 to 31.6%. Taking the cash instead leaves you $20,523 behind. The DRIP calculator ends that reinvested path at $57,148.24, with $3,156.51 a year of dividends. This page is for someone deciding whether to spend the dividend or buy more shares. The caveat: those growth rates are assumptions, and a cut changes the share count.
Last reviewed: November 18, 2026 by The Cash Flow Scout. 2026 tax figures from IRS Rev. Proc. 2025-32. Illustration, not a forecast.
DRIP calculator
This DRIP calculator works at the share level. You set a starting pile, a share price, and a dividend per share. It buys more shares when the dividend is paid, grows the dividend and the price once a year, and shows DRIP on next to DRIP off. Educational only. Not financial advice.
The DRIP calculator is an illustration, not a forecast. Educational only. Not financial advice. Dividends and prices can fall. Growth rates are assumptions. The DRIP versus cash table includes tax withheld, yield on cost, and CAGR. Tax starts at 0%, so the headline matches the example.
How to use this calculator
- Enter the cash you are starting with and the share price. The DRIP calculator turns that into a share count.
- Enter the annual dividend per share. The starting yield is that dividend divided by the price.
- Pick how often it pays. Quarterly is the usual stock. Some funds and REITs pay monthly.
- Set dividend growth, price growth, and years. Move one slider at a time so you can see which one moved the pile.
- Add a monthly purchase only if you will actually send that cash. Leave tax at 0% inside a Roth.
- Read ending value, shares, yield on cost, and the DRIP advantage. Then open the year table before you believe the headline.
What the numbers mean
- Ending value
- Shares times the price after the last year, plus any cash you did not reinvest. The price during year 20 is lower than that ending price, because price growth is applied at the end of the year for the value line.
- Shares owned
- Starting shares, plus shares bought with dividends, plus shares bought with the monthly purchase. Fractions count.
- Annual dividend income
- Shares at the end times the dividend per share that was in force during the last year. It is not next year\'s dividend.
- Yield on cost
- That annual income divided by every dollar you contributed. Price growth does not go in the denominator.
- DRIP advantage
- Ending total with reinvestment minus ending total if the same dividends were taken as cash.
Worked example: $10,000 at a 4% yield for 20 years
The DRIP calculator starts with $10,000 at $50 a share. That is 200 shares. The annual dividend is $2.00, so the starting yield is 4.00%. Payments are quarterly. The dividend grows 6% a year. The price grows 4% a year. Tax is 0%. There is no monthly purchase. Those are the boxes you see when the page loads.
With DRIP on, year 1 ends at 208.1208 shares. The price that year is still $50.00. The dividend per share is still $2.0000. Dividends credited that year are $406.04. Year 5 ends at 245.9395 shares, a $58.49 price, a $2.5250 dividend, and $604.59 of dividends. Year 10 ends at 308.7087 shares, a $71.17 price, a $3.3790 dividend, and $1,012.88 of dividends. After 20 years you hold 521.6342 shares. The ending price is $109.56. The shares are worth $57,148.24. Cash on the side is $0. Dividends credited along the way total $26,013.45. The year-20 dividend rate on those shares is $3,156.51, a 31.57% yield on the original $10,000.
Turn DRIP off and the share count stays at 200.0000. The same ending price makes those shares worth $21,911.23. The dividends you took as cash add up to $14,714.24. Total wealth is $36,625.47. Annual income at the year-20 rate is $1,210.24, a 12.10% yield on cost. The DRIP advantage is $20,522.77. Same company, same growth, different choice about the checks.
Two more switches, still on this DRIP calculator. A 15% tax on each dividend, with DRIP still on, cuts the ending total from $57,148.24 to $49,530.57. Adding $200 a month, tax back at 0% and DRIP on, reaches 1,771.9336 shares and $194,126.24. You invested $58,000 of your own cash. Yield on cost is 18.49%, lower than the no-contribution case because the new money has not had 20 years to grow its dividend. The DRIP calculator is an illustration. A cut dividend or a flat price will not match these rows.
How dividend reinvestment works
A dividend is a cash payment per share. A DRIP takes that cash and buys more of the same shares, usually the same day, usually including a fraction of a share. You do not pick the price. You get the price on the reinvestment date. This DRIP calculator uses one price for the whole year, then steps it up at the next year. Real brokers use the price that morning. The shape of the result is the same. The pennies will not match a statement.
During year y the price is the starting price times (1 + price growth) to the power of y minus 1. The dividend per share uses the same idea with dividend growth. Each month, a monthly purchase buys shares at that year\'s price first. On a payment month the dividend is shares times the annual dividend divided by the number of payments, times one minus the tax rate. DRIP on adds dividend divided by price to the share count. DRIP off adds the dividend to a cash pile that does not earn a return in this model. If you would park that cash in a savings account or another fund, this DRIP calculator is too harsh on the cash path. Say so to yourself before you treat the advantage as a decision.
On the DRIP calculator the ending value does not use the price from the last year\'s loop. It uses the starting price times (1 + price growth) to the power of the full year count. That is the price after the last growth step. Annual income uses the dividend that was already in force during the last year, not a dividend that has grown one more time. Yield on cost divides that income by cash you put in: the initial investment plus every monthly purchase. Reinvested dividends are not new cash, so they do not raise the denominator. That is the whole trick, and the whole way the figure can mislead you.
Share count is the point of a DRIP calculator. The year table shows shares next to the dividend per share. A raise plus more shares lifts income from both sides. A freeze leaves only the extra shares. A cut works against both. Type a lower growth rate, including zero, and look again. This DRIP calculator will not invent a cut for you.
Yield on cost (and why it flatters you)
Yield on cost answers a personal question: what income am I getting on the dollars I actually sent? It does not answer what a new buyer would get today. On the default DRIP calculator run, 31.57% on cost is real as a ratio of $3,156.51 to $10,000. It is not a 31.57% return you can go earn next Tuesday. A new buyer paying $109.56 for a share that pays the year-20 dividend gets a much smaller yield. Your old shares just look special because you bought them cheaper and then bought more with the dividends.
On this DRIP calculator, price growth makes yield on cost look sweeter while each new reinvestment buys fewer shares. A higher price is good for the pile you already own and bad for the next dividend\'s shopping trip. Dividend growth does the opposite for the shopping trip: a bigger dividend buys more shares even if the price is unchanged. The heatmap on this DRIP calculator crosses those two rates so you can see the ending value, not just the flattering yield. If dividend growth is high and price growth is zero, yield on cost soars and the account value is mostly the extra shares times a stuck price.
People post yield on cost the way they post a bench-press number from 2009. It is true, and it is not the weight on the bar today. Use it to see the power of a long hold and a rising dividend. Do not use it to compare a new purchase. For a new purchase, use the current yield, the payout ratio, and whether you can live through a cut. The dividend income calculator sizes a portfolio for a monthly goal. This page stays on one share count.
DRIP or take the cash?
Take the cash when the dividend is the point of the investment. Reinvest when you do not need the check and you still want to own the shares. The DRIP calculator\'s default gap is $20,522.77 of ending wealth, and also $1,946.27 a year of income given up at the end ($3,156.51 versus $1,210.24). That income gap is the part that matters if the goal is a bigger paycheck later. The wealth gap includes price growth on the extra shares. Both are illustrations. Neither is a promise.
There is a middle path the boxes can show. Reinvest for a decade, then switch the plan off and spend the dividends. Or reinvest part of the dividend by setting a tax rate, which removes a slice of every payment, and read the rest as "spent or taxed." It is a blunt model. It is still useful. A 15% drag is the taxable-account picture if the whole dividend is qualified and you are in the 15% bracket. Your bracket may differ. The year you need the cash, turn DRIP off at the broker. You do not need this page\'s permission.
Two neighboring tools stay in their lanes. The dividend income calculator asks how much to invest for a monthly dollar goal. The dividend snowball calculator asks when a whole portfolio\'s dividends cover a bill. This DRIP calculator asks what happens to one share count if you recycle the dividend. Use all three if you are building the paycheck. Use this one when a friend says "yield on cost" and you want the share math underneath it.
Cash has a job this DRIP calculator does not give it. $14,714.24 of dividends can pay a bill or buy something else. If that cash earns a return, the $20,522.77 advantage shrinks. If you spend it, the advantage is the cost of spending it. That trade is fine when spending was the plan.
Taxes on reinvested dividends
Reinvesting does not make a dividend invisible. In a taxable brokerage account the dividend is income in the year it is paid, qualified or not, whether or not you took the cash. The shares you receive have a cost basis of their own. This DRIP calculator does not track lots. It only removes a percent of each dividend before the rest buys shares or sits as cash. At 15% the default path ends at $49,530.57 instead of $57,148.24. The missing money is the tax you did not get to reinvest. It is an estimate. Check with a tax pro before you file or before you pick an account.
A Roth IRA is the clean 0% box on this DRIP calculator, if the dividend is earned inside the Roth. A traditional IRA defers the tax until you withdraw, which this page does not model. A taxable account with qualified dividends often lands near 0%, 15%, or 20% federal, plus state tax and the extra 3.8% net investment income tax if your income is high enough. Non-qualified dividends are taxed like wages. REITs and some funds throw off more of those. Type a blended rate you believe, not the rate a blog used for a different person.
How reinvested dividends are taxed in 2026
The account decides the tax, not the DRIP switch. Here is how $1,000 of reinvested dividends plays out in each place, using 2026 federal rules.
| Where the shares sit | Tax on $1,000 reinvested this year | What to log |
|---|---|---|
| Roth IRA | $0, and qualified withdrawals stay tax free | Nothing for taxes |
| Traditional IRA or 401(k) | $0 now, taxed as ordinary income when withdrawn | Nothing for taxes |
| Taxable, qualified, income under $49,450 single or $98,900 joint | $0 federal | Each lot's date and cost |
| Taxable, qualified, above those levels | $150 at 15% (20% only above $545,500 single or $613,700 joint) | Each lot's date and cost |
| Taxable, ordinary (most REITs, money funds) | Your wage bracket, for example $220 at 22% | Each lot's date and cost |
To count as qualified, you generally must hold the shares more than 60 days during the 121-day window that starts 60 days before the ex-dividend date. The 3.8% net investment income tax starts above $200,000 of modified AGI single or $250,000 joint, and those thresholds are not indexed for inflation. Your broker reports the total on Form 1099-DIV: Box 1a for all dividends, Box 1b for the qualified part. Sources: IRS Rev. Proc. 2025-32 and IRS Publication 550. For your own bracket, run the dividend tax calculator.
Every reinvested dividend is its own purchase lot. This DRIP calculator will not print a Form 1099. Your broker should. If you sell, the gain is the sale price minus those lots, and you already paid tax on the dividends. Do not count them twice.
State tax, foreign withholding on international stocks, and the timing of qualified-dividend holding periods are all outside this model. So is a dividend cut that arrives the year after you planned to retire. Growth rates are assumptions. Returns are not guaranteed. The score on the page is a checklist of the growth rate, the payment cadence, the starting yield, and the tax drag you typed. It is not a rating of a stock, and it is not advice.
DRIP FAQ
What is a DRIP?
A DRIP is a dividend reinvestment plan. The cash dividend buys more shares, including fractions, instead of landing in your checking account. On this DRIP calculator, $10,000 buys 200 shares at $50. A $2.00 dividend is a 4.00% starting yield. With the dividend growing 6% a year and the price growing 4%, DRIP on ends at 521.6342 shares and $57,148.24.
Are reinvested dividends taxed?
In a taxable account, yes. The IRS taxes the dividend in the year you receive it, even when the broker spends it on more shares. This DRIP calculator shows the drag as a percent of each dividend. At 0% tax the ending value is $57,148.24. At 15% it falls to $49,530.57. A Roth or other tax-sheltered account is the 0% case. These are estimates. Check with a tax pro.
What is yield on cost?
Yield on cost is the annual dividend at the end, divided by the cash you actually put in. It is not the yield a new buyer would get. On the DRIP calculator the original $10,000 produces $3,156.51 a year by year 20 with DRIP on, which is a 31.57% yield on cost. Taking the cash instead leaves a 12.10% yield on cost, because you still own only 200 shares. The current price yield is much lower. The number flatters you if you treat it like a return you can earn on new money.
Is DRIP better than taking cash dividends?
It is better for the pile, worse for this month's bills. On the DRIP calculator the reinvested path is worth $20,522.77 more after 20 years ($57,148.24 versus $36,625.47). The cash path pays you $14,714.24 along the way and ends with $1,210.24 a year. The reinvested path ends with $3,156.51 a year and no cash on the side. If you need the income now, take the cash. If you do not, reinvesting buys the future income.
How often are dividends reinvested?
As often as the company pays. This DRIP calculator lets you pick monthly, quarterly, semiannual, or annual. The default is quarterly. In year 1 the quarterly path credits $406.04 and ends the year at 208.1208 shares, still at the $50 price and a $2.0000 dividend. Year 5 is 245.9395 shares, a $58.49 price, a $2.5250 dividend, and $604.59 of dividends. Year 10 is 308.7087 shares and $1,012.88 of dividends. More frequent payments compound a little faster. They do not change the growth rates you typed.
Should I turn on DRIP in a taxable account?
It can still make sense, but you owe tax on every reinvested dividend that year with no cash set aside to pay it. For 2026, qualified dividends are taxed at 0% while taxable income stays at or under $49,450 single or $98,900 married filing jointly (IRS Rev. Proc. 2025-32), so many modest earners pay nothing. Above that, plan for 15% and keep a little cash for April.
How do I track cost basis on reinvested dividends?
Each reinvestment is a new purchase lot, and its cost basis is the dividend amount that bought it. Brokers track this for shares bought since 2011, but transfers can lose the trail. Keep your yearly Form 1099-DIV, because Box 1a shows the dividends you already paid tax on. Forgetting that basis means paying tax on the same dollars twice when you sell.
Can I DRIP fractional shares?
Most brokers will. This DRIP calculator assumes they do, which is why 200 shares become 521.6342 shares instead of a whole-share count with leftover cash. If your broker only buys whole shares, the leftover sits as cash and the share count runs a bit behind this illustration. Add a monthly purchase if you want new money in the same picture. $200 a month for 20 years, still at these growth rates and with DRIP on, ends at 1,771.9336 shares, $194,126.24, on $58,000 invested, and an 18.49% yield on cost.
More free tools: Dividend tax · Dividend calendar
Educational only. Not financial advice. Dividends and prices can fall; growth rates are assumptions.